As the dust clears and we realize Janet Yellen’s comments have not crashed the stock market, I thought it was a good time to review some charts that actually present bullish possibilities. You have probably by now heard plenty about how ‘tapering’ or an emerging market crisis will eventually derail markets; and they may indeed. But I believe it’s always beneficial to examine both sides. So I’ll present three charts with bullish possibilities from a technical perspective.
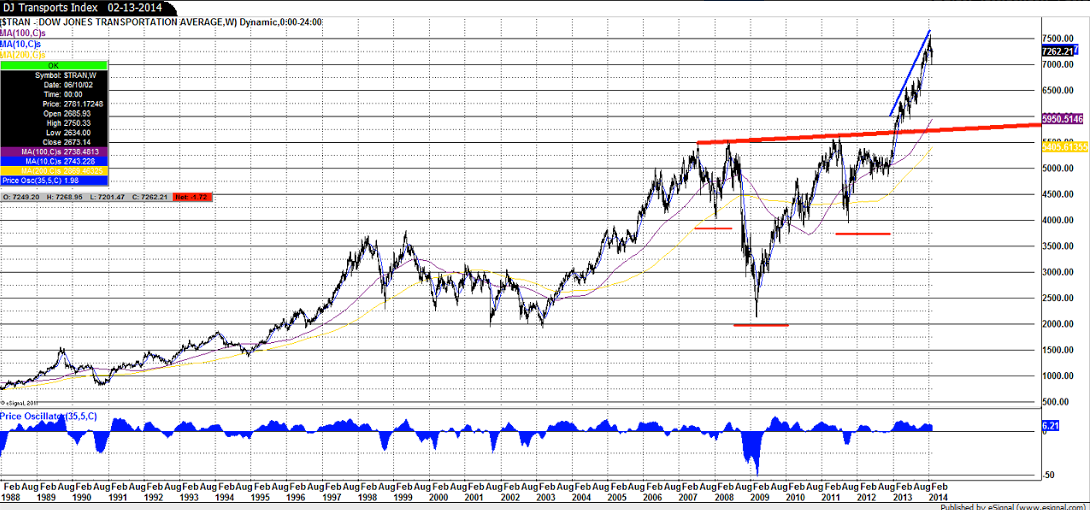
The first is that of the Dow Jones Transports Index. The transports were a true driver of the market in 2013, no pun intended. You can easily see the steep upward slope of the index last year. The large horizontal red line represents the neckline of an inverted head-and-shoulders pattern that I’ve been tracking. The inverted head and the two shoulders are highlighted for your viewing. They are seen as the formations just above the three small horizontal red lines. If this pattern proceeds to completion, the index has more room to run.

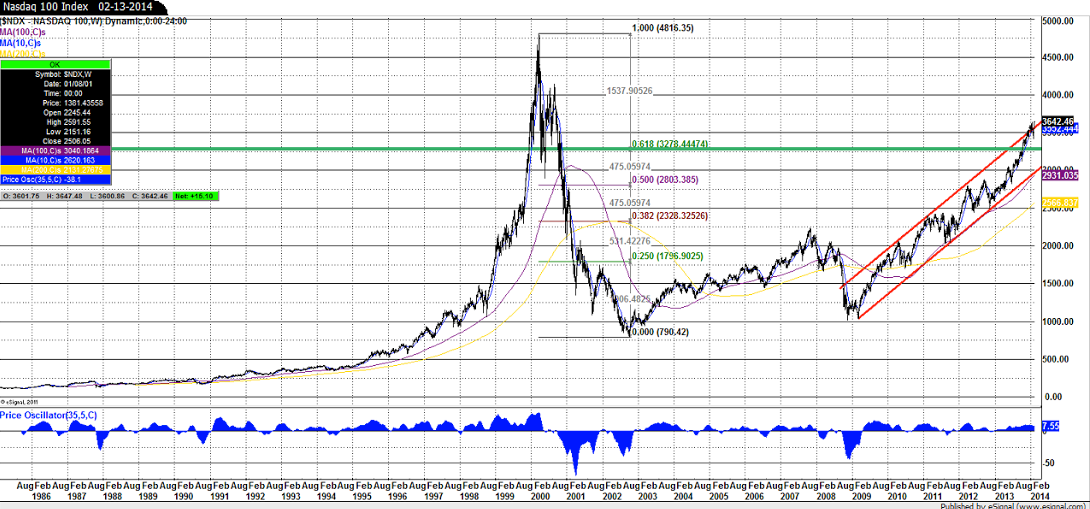
The next chart is the Nadaq 100 Index. The index made a new all-time high just today. Note the well-established bullish trend channel that has been in place since the cyclical market low of early 2009. Perhaps even more bullish from a long term perspective is the fact that the index has now rallied through the 61.8 % Fibonacci retracement of the tech crash of 2000-2002. This area is represented as the horizontal green line. If this area is not retested, or if it holds on any future retest, that would be very bullish for big tech and the stock market in general since big tech has become a market leader. This is a critical area for you to watch.

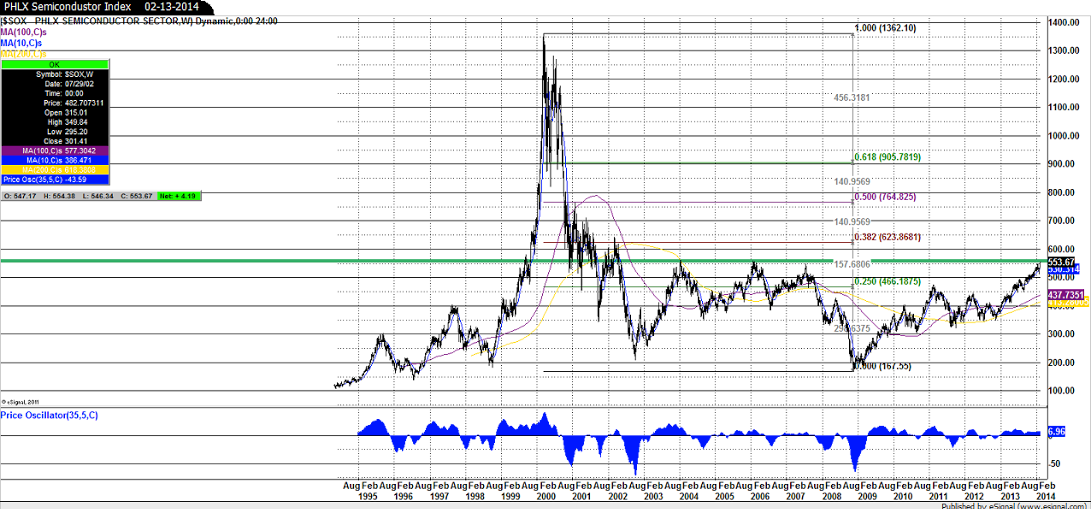
As an addendum to the Nasdaq 100 chart, allow me to present the PHLX Semiconductor Sector Index. I’d first like to mention that there was a methodology change for the index in September of 2013. This change allows for companies within the index to be replaced each annual September if their market cap had slipped and brought them out of the largest 30 companies. But even as there was a shift last year, you can see on the chart how there does not appear to be any unusual market performance accompanying this change. However, what is prevalent and I believe extremely relevant is that fact that the index is up on 10 year resistance at the 550.00 level (e.g. shown in green). This is another critical area to watch. If this area is breached with momentum, this is once again bullish for tech and for the broader market in general.

In closing, I hope I’ve provided some areas for you to watch on your charts that may help you to better understand this current garbled market setting. I realize these bullish potentials are in direct conflict with many observed macro fundamentals (e.g. enormous global debt among developed world economies, lack of stability among emerging economies as they attempt to continue growing, calls for changes in the global currency system, etc.) However, these macro fundamentals are extremely difficult to decipher given the unprecedented natures of the crisis which began in 2008 and the policies put forth since then by global central banks. Therefore, in my opinion there has been no better time in my 25 years of market research than the present for incorporating chart study into one’s analysis.