
Today I'm screening for the best performing dividend stocks from the financial sector.
I don't own banks or insurers because I still have no idea how they might alleviate their risk exposure to the financial markets. They are real black boxes for me.
However, the 20 best performing financial dividend stocks with a market capitalization over USD 300 million gained 54.50 percent to 97.22 percent since the beginning of the year are listed below. Nine have a buy or better recommendation.
HCI Group (HCI) has a market capitalization of $340.70 million. The company employs 222 people, generates revenue of $163.06 million and has a net income of $30.16 million. The firm’s earnings before interest, taxes, depreciation and amortization (EBITDA) amounts to $51.33 million. The EBITDA margin is 31.48 percent (the operating margin is 30.41 percent and the net profit margin 18.49 percent). HCI shares gained 54.50 percent year-to-date.
Financial Analysis: The total debt represents 0.00 percent of the company’s assets and the total debt in relation to the equity amounts to 0.00 percent. Due to the financial situation, a return on equity of 31.71 percent was realized. Twelve trailing months earnings per share reached a value of $4.07. Last fiscal year, the company paid $0.88 in the form of dividends to shareholders. Forward P/E: 7.98.
Market Valuation: Here are the price ratios of the company: The P/E ratio is 7.68, the P/S ratio is 2.09 and the P/B ratio is finally 2.80. The dividend yield amounts to 2.88 percent and the beta ratio has a value of 0.84.
Assured Guaranty (AGO) has a market capitalization of $4.31 billion. The company employs 319 people, generates revenue of $973.00 million and has a net income of $110.00 million. The firm’s earnings before interest, taxes, depreciation and amortization (EBITDA) amounts to $238.00 million. The EBITDA margin is 24.46 percent (the operating margin is 13.57 percent and the net profit margin 11.31 percent). AGO shares gained 60.92 percent year-to-date.
Financial Analysis: The total debt represents 16.07 percent of the company’s assets and the total debt in relation to the equity amounts to 55.47 percent. Due to the financial situation, a return on equity of 2.28 percent was realized. Twelve trailing months earnings per share reached a value of $2.46. Last fiscal year, the company paid $0.36 in the form of dividends to shareholders. Forward P/E: 8.46.
Market Valuation: Here are the price ratios of the company: The P/E ratio is 9.23, the P/S ratio is 4.42 and the P/B ratio is finally 0.88. The dividend yield amounts to 1.76 percent and the beta ratio has a value of 2.52.
Fortress Investment Group (FIG) has a market capitalization of $3.43 billion. The company employs 976 people, generates revenue of $969.87 million and has a net income of $218.82 million. The firm’s earnings before interest, taxes, depreciation and amortization (EBITDA) amounts to $92.36 million. The EBITDA margin is 9.52 percent (the operating margin is 6.36 percent and the net profit margin 22.56 percent). FIG shares gained 63.57 percent year-to-date.
Financial Analysis: The total debt represents 6.91 percent of the company’s assets and the total debt in relation to the equity amounts to 23.86 percent. Due to the financial situation, a return on equity of 11.31 percent was realized. Twelve trailing months earnings per share reached a value of $0.17. Last fiscal year, the company paid $0.20 in the form of dividends to shareholders. Forward P/E: 9.67.
Market Valuation: Here are the price ratios of the company: The P/E ratio is 40.66, the P/S ratio is 3.53 and the P/B ratio is finally 5.24. The dividend yield amounts to 3.40 percent and the beta ratio has a value of 2.43.
BGC Partners (BGCP) has a market capitalization of $1.06 billion. The company employs 6,547 people, generates revenue of $1.766 billion and has a net income of $35.51 million. The firm’s earnings before interest, taxes, depreciation and amortization (EBITDA) amounts to $312.56 million. The EBITDA margin is 17.69 percent (the operating margin is 3.15 percent and the net profit margin 2.01 percent). BGCP shares gained 92.10 percent year-to-date.
Financial Analysis: The total debt represents 27.54 percent of the company’s assets and the total debt in relation to the equity amounts to 109.27 percent. Due to the financial situation, a return on equity of 5.85 percent was realized. Twelve trailing months earnings per share reached a value of $0.14. Last fiscal year, the company paid $0.63 in the form of dividends to shareholders. Forward P/E: 10.53.
Market Valuation: Here are the price ratios of the company: The P/E ratio is 45.01, the P/S ratio is 0.60 and the P/B ratio is finally 2.43. The dividend yield amounts to 7.59 percent and the beta ratio has a value of 1.70.
Take a closer look at the full list of the best performing financial dividend stocks and which of them are still cheap. The average P/E ratio amounts to 24.73 and forward P/E ratio is 18.31. The dividend yield has a value of 2.06 percent. Price to book ratio is 5.49 and price to sales ratio 5.84. The operating margin amounts to 32.08 percent and the beta ratio is 1.42. Stocks from the list have an average debt to equity ratio of 0.41.
Here is the full table with some fundamentals (TTM): 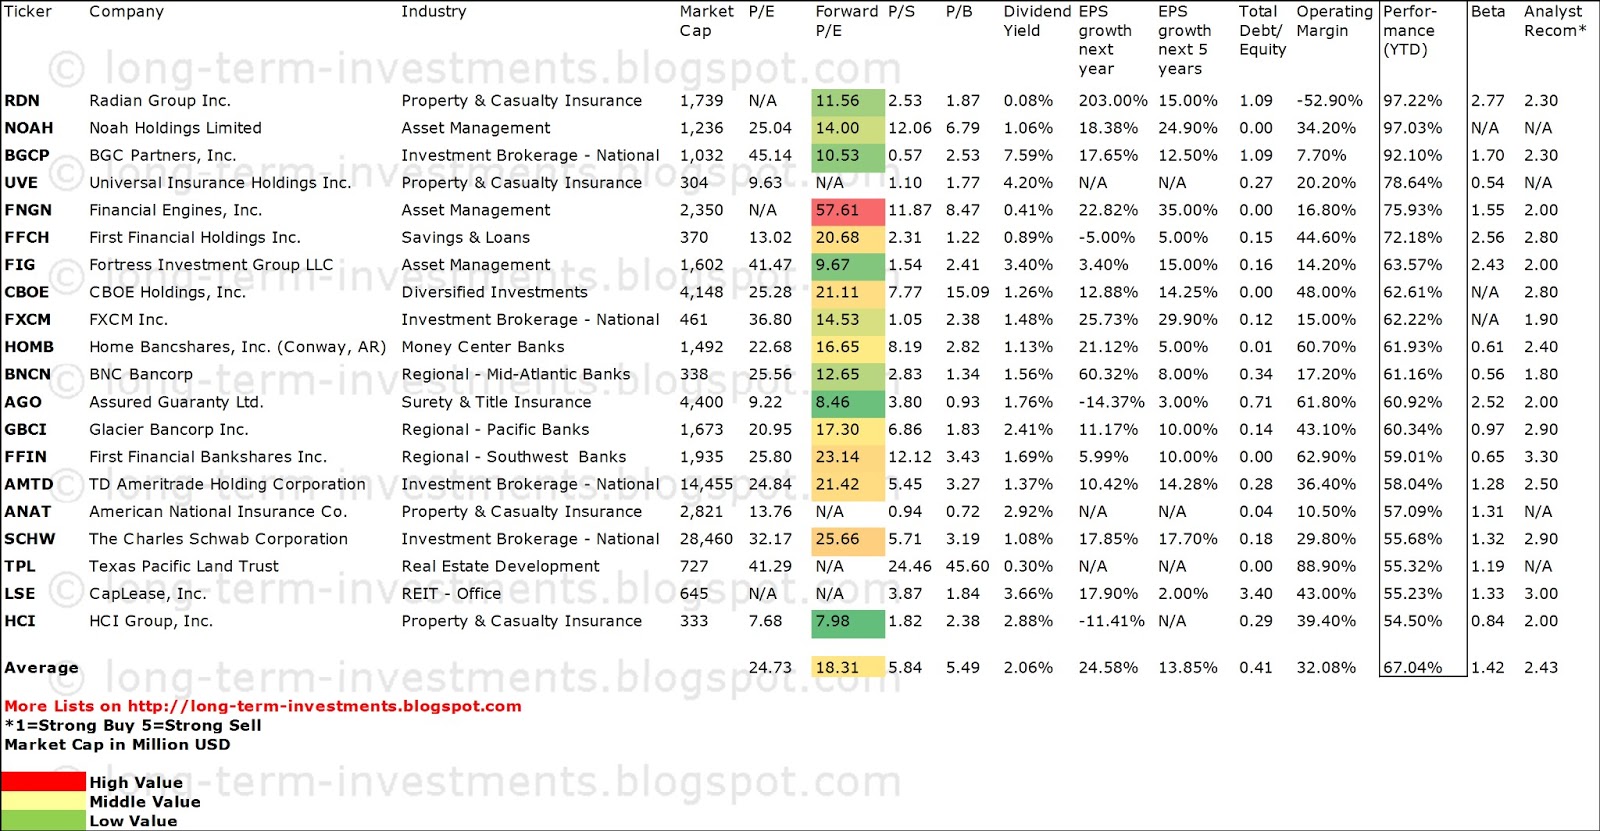
Related stock ticker symbols:
RDN, NOAH, BGCP, UVE, FNGN, FFCH, FIG, CBOE, FXCM, HOMB, BNCN, AGO, GBCI,
FFIN, AMTD, ANAT, SCHW, TPL, LSE, HCI
Disclosure: I have no positions in any stocks mentioned, and no plans to initiate any positions within the next 72 hours. I receive no compensation to write about any specific stock, sector or theme.
- English (UK)
- English (India)
- English (Canada)
- English (Australia)
- English (South Africa)
- English (Philippines)
- English (Nigeria)
- Deutsch
- Español (España)
- Español (México)
- Français
- Italiano
- Nederlands
- Português (Portugal)
- Polski
- Português (Brasil)
- Русский
- Türkçe
- العربية
- Ελληνικά
- Svenska
- Suomi
- עברית
- 日本語
- 한국어
- 简体中文
- 繁體中文
- Bahasa Indonesia
- Bahasa Melayu
- ไทย
- Tiếng Việt
- हिंदी
20 Cheapest Dividend Paying Financials With Highest YTD Performance
Published 07/10/2013, 04:15 AM
Updated 07/09/2023, 06:31 AM
20 Cheapest Dividend Paying Financials With Highest YTD Performance
3rd party Ad. Not an offer or recommendation by Investing.com. See disclosure here or
remove ads
.
Latest comments
Install Our App
Risk Disclosure: Trading in financial instruments and/or cryptocurrencies involves high risks including the risk of losing some, or all, of your investment amount, and may not be suitable for all investors. Prices of cryptocurrencies are extremely volatile and may be affected by external factors such as financial, regulatory or political events. Trading on margin increases the financial risks.
Before deciding to trade in financial instrument or cryptocurrencies you should be fully informed of the risks and costs associated with trading the financial markets, carefully consider your investment objectives, level of experience, and risk appetite, and seek professional advice where needed.
Fusion Media would like to remind you that the data contained in this website is not necessarily real-time nor accurate. The data and prices on the website are not necessarily provided by any market or exchange, but may be provided by market makers, and so prices may not be accurate and may differ from the actual price at any given market, meaning prices are indicative and not appropriate for trading purposes. Fusion Media and any provider of the data contained in this website will not accept liability for any loss or damage as a result of your trading, or your reliance on the information contained within this website.
It is prohibited to use, store, reproduce, display, modify, transmit or distribute the data contained in this website without the explicit prior written permission of Fusion Media and/or the data provider. All intellectual property rights are reserved by the providers and/or the exchange providing the data contained in this website.
Fusion Media may be compensated by the advertisers that appear on the website, based on your interaction with the advertisements or advertisers.
© 2007-2024 - Fusion Media Limited. All Rights Reserved.