Long/short equities is a market strategy in which investors take a long position in stocks or buy stocks they believe will rise in the future and, at the same time take short positions, or short stocks they anticipate will lose value in the future.
A long-short equity strategy is designed to decrease exposure to volatility and uncertainty across the broader market. Instead, the long-term total return relies on the difference, or spread, between long and short positions.
A range of exchange-traded funds (ETFs) exists in the long/short equity universe. Managers of such funds believe they can add value through active management and minimize volatility seen in the broader market.
For instance, long/short equity funds may take long positions in businesses that offer value and/or long-term growth potential. At the same time, they usually short stocks that they believe are overvalued and headed for a selloff, in order to hedge against the ETF's long exposures.
Many of these funds are likely to be weighted more toward long investments. However, investors should do thorough research to understand the strategy behind a given fund before committing capital.
Here are our two long/short ETF choices worth consideration:
1. ProShares Long Online/Short Stores ETF
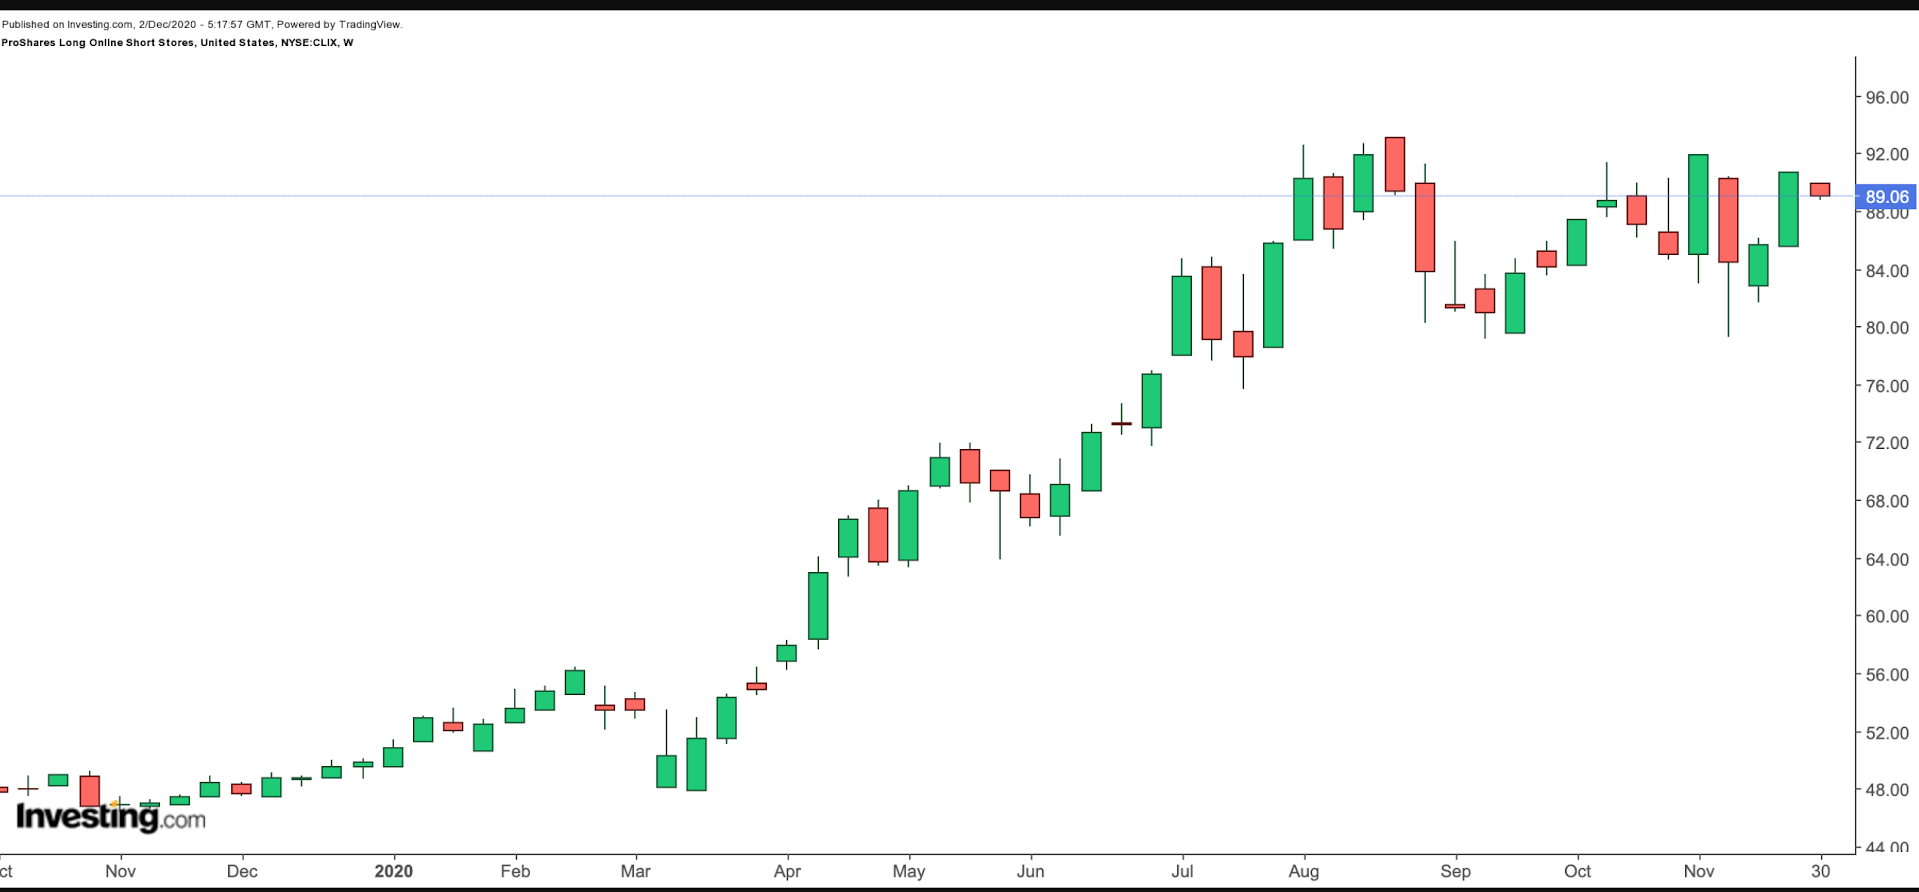
- Current Price: $89.06
- 52-Week Range: $47.44-93.17
- Year-to-date (YTD) change: 82.44%
- Dividend Yield: 0.48%
- Expense Ratio: 0.65%
The ProShares Long Online/Short Stores ETF (NYSE:CLIX) provides a 100% long position in e-commerce businesses or retailers that primarily sell online. Simultaneously, CLIX has a 50% short position in those that rely principally on revenue from brick-and-mortar or physical stores. The fund started trading in late 2017 and has around $235 million under management.

E-commerce companies have captured increased market share in 2020. Some of this growth has come at the expense of traditional brick-and-mortar based companies. For instance, Cyber Monday, which was Nov. 30, was "the biggest online shopping day in U.S. history, bringing in as much as $12.7 billion in online sales and surpassing Black Friday's digital numbers."
CLIX, which has 26 holdings, tracks the ProShares Long Online/Short Stores Index. This index has, in effect, two components—100% long the ProShares Online Retail Index and 50% short the Solactive-ProShares Bricks and Mortar Retail Store Index.
Among the long positions held are Amazon.com (NASDAQ:AMZN), Alibaba (NYSE:BABA), Etsy (NASDAQ:ETSY), Chewy (NYSE:CHWY) and Wayfair (NYSE:W).
Leading names in the Solactive-ProShares Bricks and Mortar Retail Store Index, which the fund shorts, include Children's Place (NASDAQ:PLCE), Macy's (NYSE:M), Kohl's (NYSE:KSS), ODP (NASDAQ:ODP) and Sally Beauty Holdings (NYSE:SBH).
So far this year, CLIX has climbed by over 80%, hitting a record high of $93.17 in late August. In other words, the strategy has worked well.
Long-term investors who believe the transformation of retailers from physical to online stores is here to stay could keep CLIX on their radar. The fund would offer better value around $82.5.
2. First Trust Long/Short Equity ETF
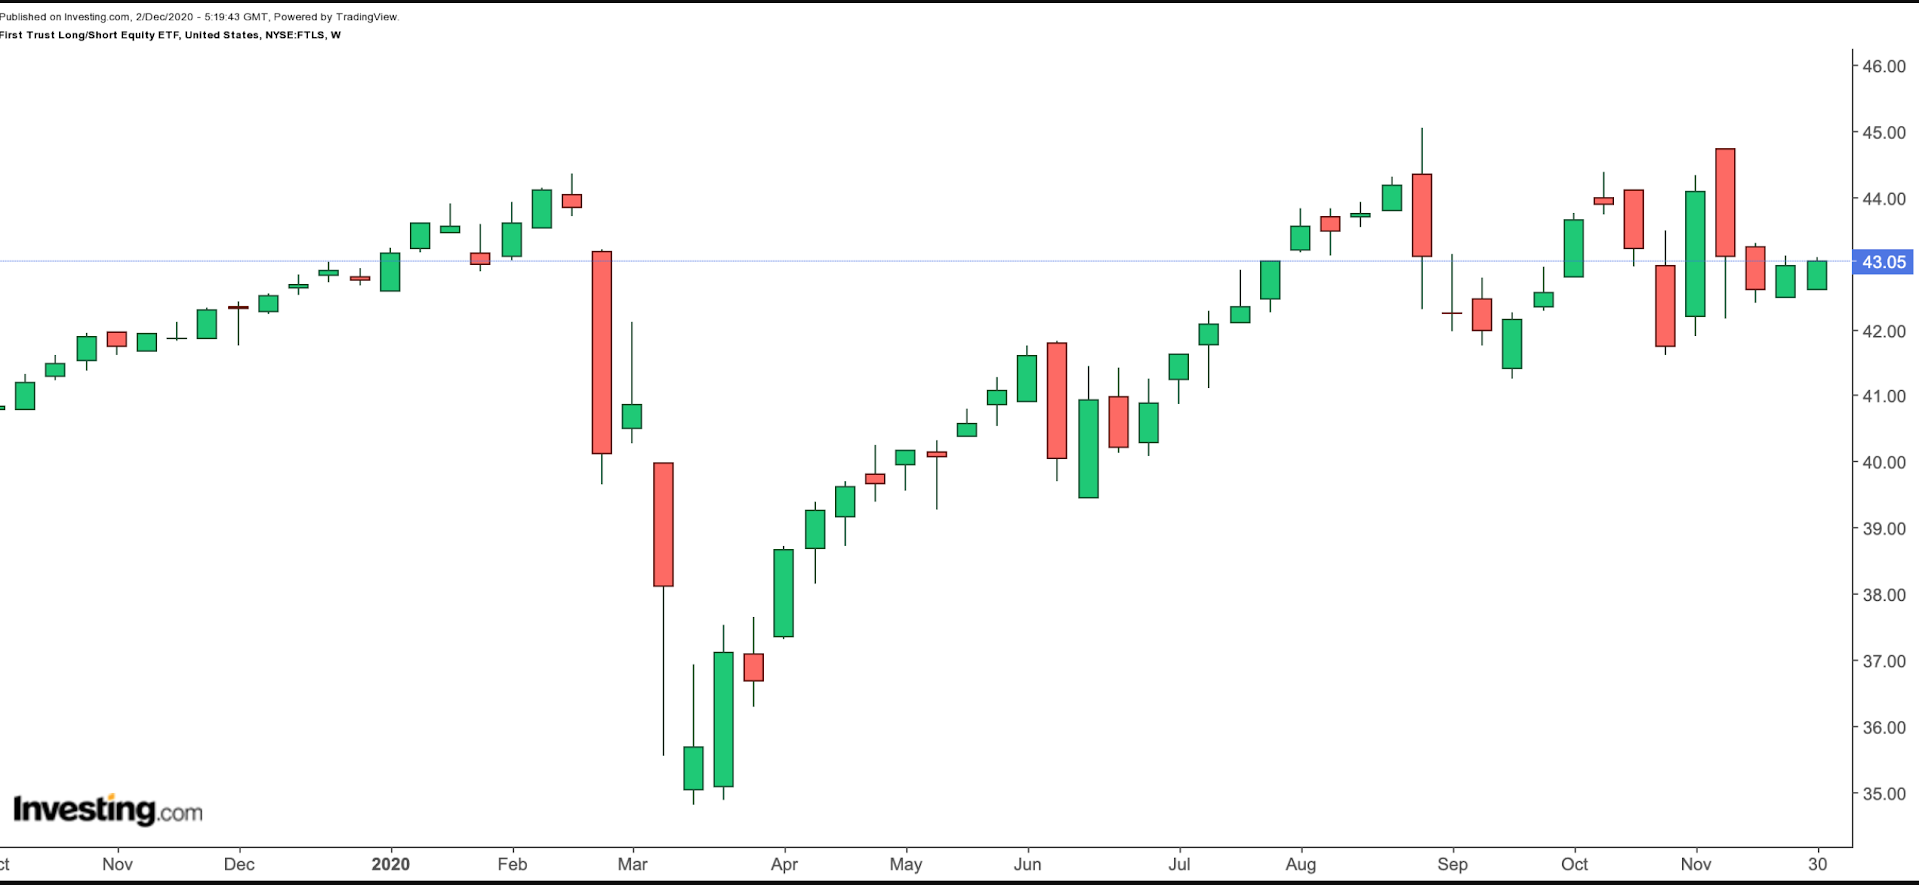
- Current Price: $43.05
- 52-Week Range: $34.82 - $45.03
- YTD Change: Up 0.51%
- Dividend Yield: 0.26%
- Expense Ratio: 0.95%
Our second fund is the First Trust Long/Short Equity ETF (NYSE:FTLS), providing long exposure to shares which it believes will have high-quality earnings while giving short exposure to stocks that will show lower quality earnings. The fund uses a proprietary accounting methodology when determining high- and low-quality earnings stocks.

FTLS started trading in 2014 and has $301 million under management. The overall portfolio is typically 80% to 100% invested in long positions and 0% to 50% invested in short positions. Several of the names the fund is currently long on are Apple (NASDAQ:AAPL), Microsoft (NASDAQ:MSFT), HP (NYSE:HPQ), Wix.com (NASDAQ:WIX) and Analog Devices (NASDAQ:ADI).
Among its short positions are Groupon (NASDAQ:GRPN), Air Products and Chemicals (NYSE:APD), Disney (NYSE:DIS), Fidelity National Information Services (NYSE:FIS) and Liberty Broadband (NASDAQ:LBRDA).
YTD, the fund has returned less than 1%, so it is about flat, despite the bull market that started over a decade ago and keeps charging ahead. Investigating why the return is flat is key for potential investors.
Is the flat return because they are happy to buy everything in the market despite earnings quality? Or is the fund’s proprietary methodology not appropriate for the current conditions in the overall market?
We believe the fund deserves to be on your radar screen, but not necessarily in your portfolio. At least not yet.
