
Summary
Long-term Gold Forecast.
Aggressive Play in Gold: Direxion Daily Junior Gold Miners Index Bull 3x Shares ETF.
Less-Aggressive Play in Gold: Taseko Mines.
Long-Term Gold Forecast
Based on the EMA2 Trade Live Analytics's proprietary Variable Changing Price Momentum Indicator (VC PMI), I analyzed levels of supply and demand for gold that I expect to see for the twelve months from September 28, 2017 to September 28, 2018. The outlook is bullish and there are two excellent aggressive plays to take full advantage of the forecast: Direxion Daily Junior Gold Miners Bull 3X Shares (NYSE:JNUG) and Taseko Mines Limited (NYSE:TGB).
On September 28, 2017, gold closed at $1288, above the 50-day moving average, which I use for long-term trend analysis and confirms that the long-term trend momentum for gold is bullish. The VC PMI also gives you the other side of the trade. If the market closes below $1253, it would negate this long-term bullish trend and turn neutral. I use the long-term trend momentum to get a clear picture of the long-term trend analysis using the 50-day moving average. I also analyzed the yearly price momentum based on a yearly moving average, which for gold is $1263. The yearly moving average is based on analysis of supply and demand. The market closed at $1288, which indicates that the long-term price is bullish. The VC PMI forecasts an average price for gold over the next twelve months of $1264. The fact that the market closed above the $1264-level gives us an indication that the long-term price momentum is bullish coming into the next 12 months.
The VC PMI algorithm also gives us a protective level which you can choose to use to identify a change or shift in the market. Depending on your objectives, you can use this information to position yourself accordingly. A price above $1264 is bullish, which automatically identifies for us the extreme of the supply for next year. The extreme supply levels are at $1386 to $1484. The yearly trend is bullish and the average price is $1264 for the next year, which also identifies the extreme above the mean. You can use the extreme above the mean as your target, which are $1386 to $1384 and are the sell 1 and sell 2 levels. We recommend easing out of long positions at the sell 1 and 2 levels as you take profits off the table.
It is clear that $1264 is a level you want to watch. If the market closes below $1264, the market momentum changes from bullish to neutral. If that happens, you should cover any bearish positions if you've taken any, since the sentiment will change to levels of $1166 to $1044. A second confirmation of trading below $1264 would activate buy signals at $1166 and $1044. The market may not go down to such levels, but a move to $1264 triggers the indication that you should be alert for the possibility of lower prices.
Overall, the VC PMI forecasts September 28, 2017 to September 28, 2018 as long-term bullish market for gold with targets of $1386 to $1484.
Now that we've identified the yearly long-term trend in the price of gold, which is bullish, we can take a look at two different strategies to take advantage of the trend: a more aggressive and a less aggressive strategy.
Aggressive Play in Gold Mining Shares: Direxion Daily Junior Gold Miners Index Bull and Bear 3X Shares ETF
The Direxion Daily Junior Gold Miners Index Bull and Bear 3X Shares ETF is an excellent, aggressive vehicle to take advantage of the predicted bullish trend in gold.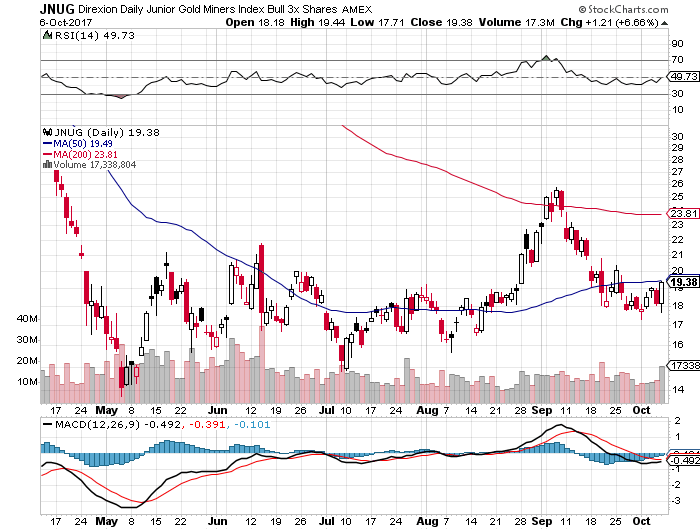
I recommend using JNUG for a short- to intermediate-term investment. JNUG is a highly volatile (up or down 300 percent of the underlying MVIS Global Junior Gold Miners Index in a day), tradable instrument that does not carry the risk of a futures contract in terms of margin exposure. By investing about the same amount that you would need to put up on a margin deposit ($10,000), you can use this instrument without any margin requirement. As the Direxion site states:
The MVIS Global Junior Gold Miners Index (MVGDXJTR) tracks the performance of foreign and domestic micro-, small- and mid-capitalization companies that generate, or demonstrate the potential to generate, at least 50% of their revenues from, or have at least 50% of their assets related to, gold mining and/or silver mining, hold real property or have mining projects that have the potential to produce at least 50% of the company's revenue from gold or silver mining when developed, or primarily invest in gold or silver.
The VC PMI algorithm allows us to identify the supply and demand extremes for JNUG, as well as the average price for the coming week. In using the same principle as we used in the yearly report, let's take a look at what we can expect in the coming week from JNUG.
The market closed at $19.38 last Friday (October 6, 2017), which is below the 9-day moving average of $19.99. This price confirms that the trend momentum is bearish coming into this week. The VC PMI algorithm gives you a stop or a pivot point where this trend momentum would be negated from bearish to neutral, which is on a close above $19.99. The VC PMI identifies the average price of JNUG for the week as $18.71. The fact that the market closed at $19.38 Friday, tells us that the market is turning bullish.
We are then able to extrapolate the extreme above the mean, which indicates what we call our sell 1 and sell 2 points. If the market comes down to $18.71, it would negate the bullishness and turn the market to a neutral position. You can use $18.71 as a stop. Coming into next week, the algorithm indicates that we should look to take profits at the extreme above the mean of $18.71 if we see prices reach $20.11 to $20.84 during the coming week.
The VC PMI gives you a level where you can see when the up-trend or the price momentum would be negated to neutral, which is $18.71. You can use $18.71 as a protective stop. If the market moves down to $18.71, then it automatically activates the extreme blow the mean levels of $17.98 and $16.58. The market might be moving lower. This would tell you to cover any bearish sentiment or short position at $17.98 to $16.58, with a trigger price of $17.98 and an automatic stop at $16.58. If the market moves down to $16.58, it would trigger a buy 2 signal, so you would hit a buy 1 trigger at $17.98 and buy 2 at $16.58. At that point, you would reverse and go long. If the market hits a trigger at $17.98 or $16.58, I recommend using $16.58 as your stop. If you buy at $17.98 and the market turns around and closes above $17.98, you can raise your stop at that point to $17.98, your entry point. The first target would then be $18.71, which is the price momentum level from the buy 1 or buy 2 levels. If the market closes above $18.71 twice, it would activate the upward targets of $20.11 and $20.84.
In summary, I am bullish on JNUG for the coming week since the market closed above $18.71. The targets for next week are sell 1 at $20.11 and sell 2 at $20.84. You should lighten your long positions at the sell 1 level and then do so even more at the sell 2 level as you gradually take profits off the table. This strategy is more aggressive and is for traders who are aware of the risk, adept at money management and appreciate the volatility of the market, as well as the risks involved in short-term day trading or short-term position trading. The VC PMI adds a tremendously helpful trading tool to your arsenal of indicators, which provides unrivaled accuracy.
Less-Aggressive Play in Gold: Taseko Mines
Having reviewed a more aggressive play, now we can analyze a less aggressive approach to seek to take advantage of the long-term bullish market in gold for the next year. I recommend using an instrument to diversify from futures and ETFs by investing in a stock that so far has proven to be on fire: Taseko Mines, Ltd., which is traded on the AMEX stock market.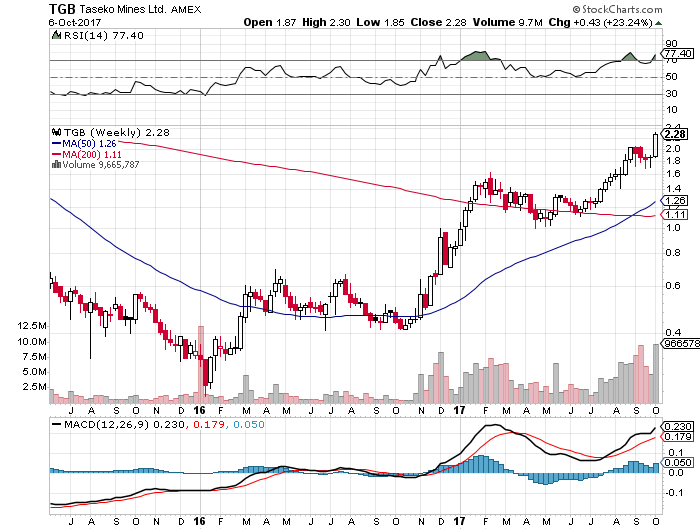
After trading around 30 cents, in March 2016 Taseko broke out to about 40 cents. The price then rallied to around 70 cents in the middle of May. It then traded back down to about 40 cents in the middle of 2016 through the end of October 2016. Taseko has had a tremendous rally since the bottom occurred in April 2017 and the price has now moved above a dollar a share. Shares rallied from the low of April 19 at $1 a share to $2.28, which was the close on October 6, 2017. This is a phenomenal return, and has essentially has been confirmed by the golden cross, which is what some people call it when the 50-day moving average, which for Taseko is $1.26, moves above the 200-day moving average, which for Taseko is $1.11. As of the close on October 2, the market broke out of the previous high and resistance levels and is hovering around $2.02 per share.
Our proprietary algorithm, the VC PMI, based on supply and demand, forecasts the average price next week for Taseko to be $2.14. The price closing at $2.28 above the 9-day moving average of $1.86 confirms that the trend momentum is bullish. We use the 9-day moving average to see supply and demand levels, which serve as a pivot point. You should use $1.86 as a protective stop. If the market moves below $1.86, it would negate the bullish signal and the trend momentum would be neutral. If Taseko does move below $1.86, pay attention because it opens up the possibility of even lower prices.
The VC PMI also identified another level or pivot point for a protective stop to manage your position. The algorithm tells us that if Taseko closes below $2.14, the bullish price momentum trend is negated and will turn from bullish to neutral. The VC PMI also identifies the extreme above the mean levels, which are sell 1 at $2.44, at which point you would lighten up or take some profits, and the sell 2 level at $2.56. Such moves would lock in pretty decent profits and serve as an excellent, prudent objective. Depending on your style of managing your portfolio, use these two sell levels to gradually transition out of your position. Unlike a futures contract, for which most investors can only handle one position, which makes it impossible to gradually liquidate, Taseko provides the opportunity to buy enough stocks to gradually reap profits as the stock runs up.
I expect gold to move above $1400 and, if it does, Taseko can give you phenomenal returns. From the lows back in January 2016, when the stock was 25 or 30 cents, Taseko has now moved up above $2.00 to $2.28. This could be just the beginning of a tremendous opportunity if the price of gold continues to transition from a bearish to a bullish trend.
For the next week, the target for Taseko Mines above the mean of $2.14 (the average price), and the price at which I recommend taking profits is at $2.44 to $2.59. If the market comes down below $2.14 and closes below $2.14 for a second time in a row, it would negate the bullish weekly momentum and activate the extreme below the mean targets of $1.99 to $1.69. You should use the average predicted price next week of $2.14 as pivot point or stop to protect your long positions.
Conclusion
The fundamentals and technical analysis point to a bullish trend in gold. You can take advantage of a rising price of gold by investing in the aggressive JNUG or the somewhat less aggressive Taseko Mines shares. Either way, the profit potential is great.