
I’ve received access to the gurufocus database recently. They run several automated screeners to find great value stocks.
Eighteen stocks from the screen yielded over the mentioned level. Two of them got a high-yield and twelve stocks have a buy or better rating.
Apple (AAPL) has a market capitalization of $442.61 billion. The company employs 72,800 people, generates revenue of $156.508 billion and has a net income of $41.733 billion. Apple’s earnings before interest, taxes, depreciation and amortization (EBITDA) amounts to $58.51 billion. The EBITDA margin is 37.39 percent (the operating margin is 35.30 percent and the net profit margin 26.67 percent).
Financial Analysis: The total debt represents 0.00 percent of Apple’s assets and the total debt in relation to the equity amounts to 0.00 percent. Due to the financial situation, a return on equity of 42.84 percent was realized by Apple. Twelve trailing months earnings per share reached a value of $40.04. Last fiscal year, Apple paid $2.65 in the form of dividends to shareholders.
Market Valuation: Here are the price ratios of the company: The P/E ratio is 12.17, the P/S ratio is 2.83 and the P/B ratio is finally 3.87. The dividend yield amounts to 2.50 percent and the beta ratio has a value of 0.97.
Wal-Mart Stores (WMT) has a market capitalization of $239.13 billion. The company employs 2,200,000 people, generates revenue of $469.162 billion and has a net income of $17.756 billion. Wal-Mart Stores’s earnings before interest, taxes, depreciation and amortization (EBITDA) amounts to $36.302 billion. The EBITDA margin is 7.74 percent (the operating margin is 5.93 percent and the net profit margin 3.78 percent).
Financial Analysis: The total debt represents 26.65 percent of Wal-Mart Stores’s assets and the total debt in relation to the equity amounts to 70.91 percent. Due to the financial situation, a return on equity of 23.02 percent was realized by Wal-Mart Stores. Twelve trailing months earnings per share reached a value of $5.12. Last fiscal year, Wal-Mart Stores paid $1.59 in the form of dividends to shareholders.
Market Valuation: Here are the price ratios of the company: The P/E ratio is 14.24, the P/S ratio is 0.51 and the P/B ratio is finally 3.17. The dividend yield amounts to 2.58 percent and the beta ratio has a value of 0.36.
McDonald's (MCD) has a market capitalization of $94.33 billion. The company employs 440,000 people, generates revenue of $27.567 billion and has a net income of $5.464 billion. McDonald's earnings before interest, taxes, depreciation and amortization (EBITDA) amounts to $9.865 billion. The EBITDA margin is 35.79 percent (the operating margin is 31.21 percent and the net profit margin 19.82 percent).
Financial Analysis: The total debt represents 38.52 percent of McDonald's assets and the total debt in relation to the equity amounts to 89.14 percent. Due to the financial situation, a return on equity of 36.82 percent was realized by McDonald's. Twelve trailing months earnings per share reached a value of $5.46. Last fiscal year, McDonald's paid $2.87 in the form of dividends to shareholders.
Market Valuation: Here are the price ratios of the company: The P/E ratio is 17.30, the P/S ratio is 3.42 and the P/B ratio is finally 6.19. The dividend yield amounts to 3.26 percent and the beta ratio has a value of 0.37.
Taiwan Semiconductor Manufacturing (TSM) has a market capitalization of $85.85 billion. The company employs 39,267 people, generates revenue of $16.931 billion and has a net income of $5.550 billion. Taiwan Semiconductor Manufacturing’s earnings before interest, taxes, depreciation and amortization (EBITDA) amounts to $10.448 billion. The EBITDA margin is 61.71 percent (the operating margin is 34.84 percent and the net profit margin 32.78 percent).
Financial Analysis: The total debt represents 12.25 percent of Taiwan Semiconductor Manufacturing’s assets and the total debt in relation to the equity amounts to 16.17 percent. Due to the financial situation, a return on equity of 23.48 percent was realized by Taiwan Semiconductor Manufacturing. Twelve trailing months earnings per share reached a value of $1.11. Last fiscal year, Taiwan Semiconductor Manufacturing paid $0.50 in the form of dividends to shareholders.
Market Valuation: Here are the price ratios of the company: The P/E ratio is 14.91, the P/S ratio is 5.14 and the P/B ratio is finally 3.55. The dividend yield amounts to 3.03 percent and the beta ratio has a value of 0.97.
Take a closer look at the full list of undervalued stocks with predictable business operations. The average P/E ratio amounts to 14.09 and forward P/E ratio is 12.76. The dividend yield has a value of 3.27 percent. Price to book ratio is 4.20 and price to sales ratio 2.10. The operating margin amounts to 21.34 percent and the beta ratio is 0.93. Stocks from the list have an average debt to equity ratio of 0.62.
Here is the full table with some fundamentals (TTM): 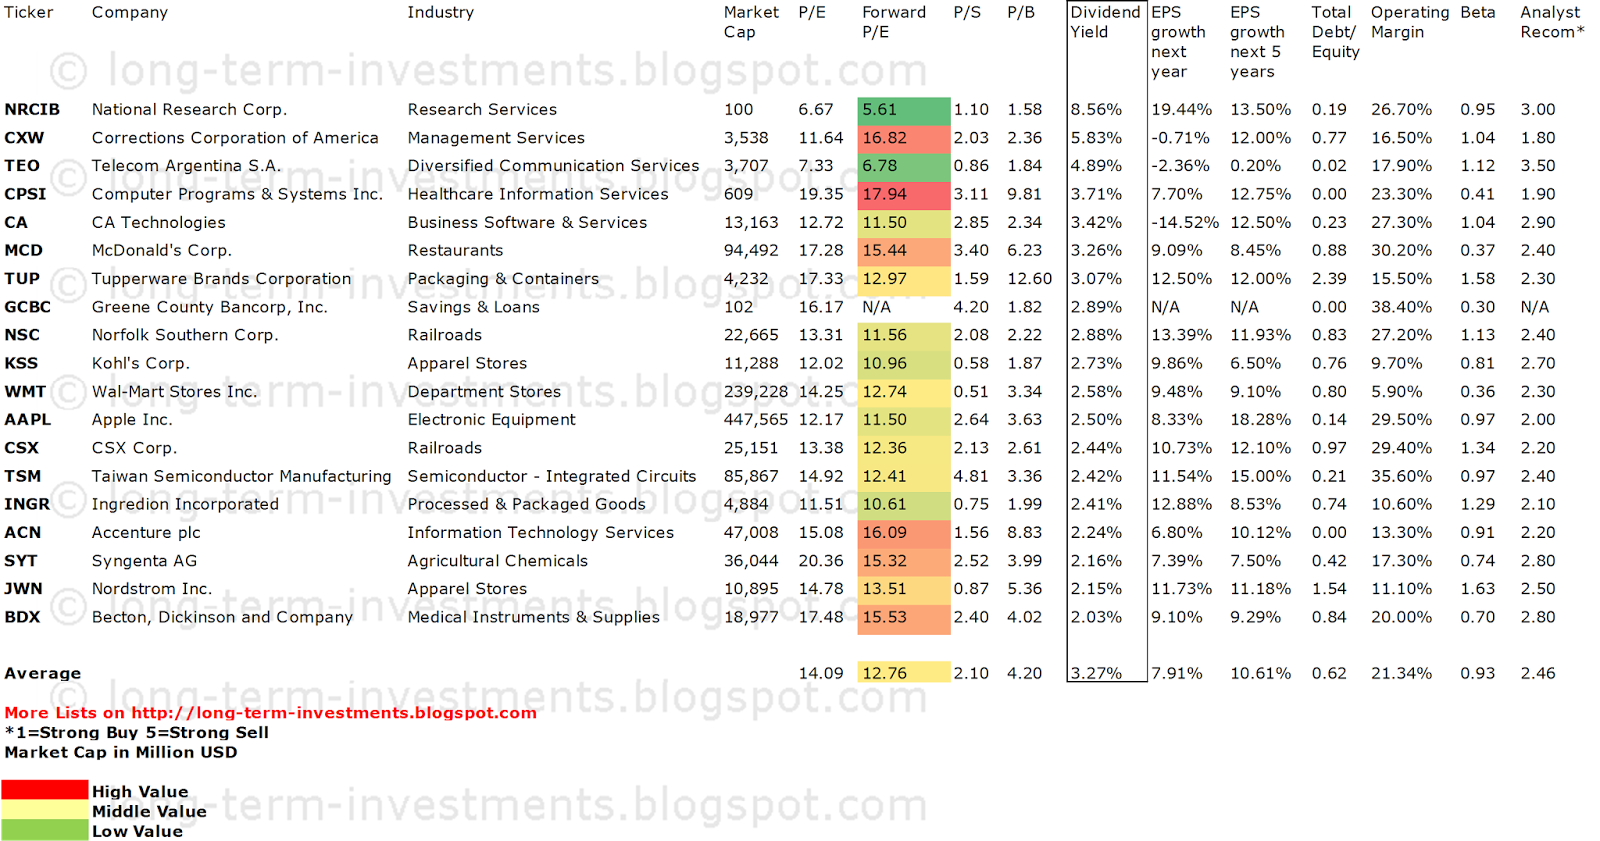
Related Stock Ticker Symbols:
NRCIB, TEO, CXW, CPSI, CA, MCD, GCBC, NSC, KSS, WMT, TUP, TSM, CSX,
AAPL, ACN, SYT, JWN, INGR, BDX
*I am long CA, TUP, MCD, WMT, CAN, BDX. I receive no compensation to write about these specific stocks, sector or theme. I don't plan to increase or decrease positions or obligations within the next 72 hours.
For the other stocks: I have no positions in any stocks mentioned, and no plans to initiate any positions within the next 72 hours. I receive no compensation to write about any specific stock, sector or theme.
- English (UK)
- English (India)
- English (Canada)
- English (Australia)
- English (South Africa)
- English (Philippines)
- English (Nigeria)
- Deutsch
- Español (España)
- Español (México)
- Français
- Italiano
- Nederlands
- Português (Portugal)
- Polski
- Português (Brasil)
- Русский
- Türkçe
- العربية
- Ελληνικά
- Svenska
- Suomi
- עברית
- 日本語
- 한국어
- 简体中文
- 繁體中文
- Bahasa Indonesia
- Bahasa Melayu
- ไทย
- Tiếng Việt
- हिंदी
18 Undervalued Stocks With Good Dividends
Published 09/02/2013, 04:54 AM
Updated 07/09/2023, 06:31 AM
18 Undervalued Stocks With Good Dividends
Latest comments
Loading next article…
Install Our App
Risk Disclosure: Trading in financial instruments and/or cryptocurrencies involves high risks including the risk of losing some, or all, of your investment amount, and may not be suitable for all investors. Prices of cryptocurrencies are extremely volatile and may be affected by external factors such as financial, regulatory or political events. Trading on margin increases the financial risks.
Before deciding to trade in financial instrument or cryptocurrencies you should be fully informed of the risks and costs associated with trading the financial markets, carefully consider your investment objectives, level of experience, and risk appetite, and seek professional advice where needed.
Fusion Media would like to remind you that the data contained in this website is not necessarily real-time nor accurate. The data and prices on the website are not necessarily provided by any market or exchange, but may be provided by market makers, and so prices may not be accurate and may differ from the actual price at any given market, meaning prices are indicative and not appropriate for trading purposes. Fusion Media and any provider of the data contained in this website will not accept liability for any loss or damage as a result of your trading, or your reliance on the information contained within this website.
It is prohibited to use, store, reproduce, display, modify, transmit or distribute the data contained in this website without the explicit prior written permission of Fusion Media and/or the data provider. All intellectual property rights are reserved by the providers and/or the exchange providing the data contained in this website.
Fusion Media may be compensated by the advertisers that appear on the website, based on your interaction with the advertisements or advertisers.
© 2007-2024 - Fusion Media Limited. All Rights Reserved.