:
All of the companies mentioned below have seen hedge fund selling during the most recent quarter (13-F filings). These companies also have significant cash holdings, when compared to quarterly operating expenses.
Average Weekly Returns:
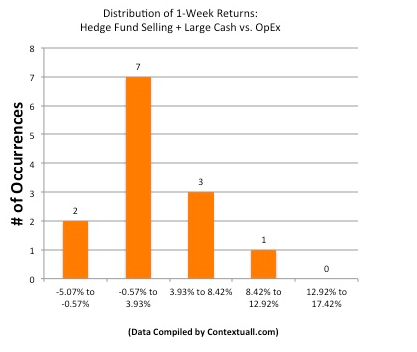
Average 1-Week Return of All Stocks Mentioned Below: 3.09%
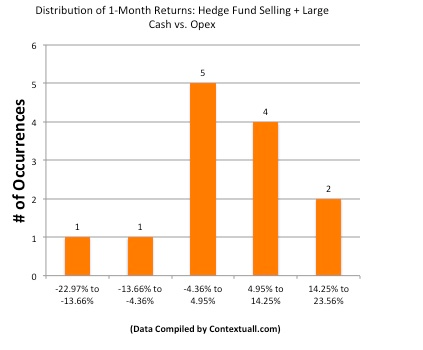
Average 1-Month Return of All Stocks Mentioned Below: 4.20%
Analysis of List Alpha:
Number of Stocks in This List Generating Excess Return vs. SP500 (Beta Adjusted Over Last Week): 7 out of 14 (50.0%)
Number of Stocks in This List Generating Excess Return vs. SP500 (Beta Adjusted Over Last Month): 7 out of 14 (50.0%)
Chart: Distribution of 1-Week Returns For All Stocks Mentioned Below 
Chart: Distribution of 1-Month Returns For All Stocks Mentioned Below
1. TiVo Inc. (TIVO): Provides technology and services for television solutions, including digital video recorders (DVRs) and connected televisions in the United States and internationally. Net institutional shares sold during the most recent quarter at 7.6M shares (6.24% of float at 121.83M shares). Average quarterly operating expense over the last five quarters at $68.77M, vs. most recent cash and short term investments at $623.55M, implies a Cash / Avg. Operating Expense ratio at 9.07.
2. Rudolph Technologies Inc. (RTEC): Designs, develops, manufactures, and sells process control defect inspection, metrology, and process control software systems to microelectronics device manufacturers. Net institutional shares sold during the most recent quarter at 5.0M shares (15.96% of float at 31.33M shares). Average quarterly operating expense over the last five quarters at $43.39M, vs. most recent cash and short term investments at $173.74M, implies a Cash / Avg. Operating Expense ratio at 4.
3. Amicus Therapeutics, Inc. (FOLD): Focuses on the discovery, development, and commercialization of orally-administered, small molecule drugs for the treatment of various human genetic diseases. Net institutional shares sold during the most recent quarter at 1.6M shares (6.47% of float at 24.73M shares). Average quarterly operating expense over the last five quarters at $18.6M, vs. most recent cash and short term investments at $106.22M, implies a Cash / Avg. Operating Expense ratio at 5.71.
4. Universal Display Corp. (PANL): Engages in the research, development, and commercialization of organic light emitting diode (OLED) technologies and materials for use in flat panel display, solid-state lighting, and other product applications. Net institutional shares sold during the most recent quarter at 2.5M shares (7.04% of float at 35.52M shares). Average quarterly operating expense over the last five quarters at $16.15M, vs. most recent cash and short term investments at $238.78M, implies a Cash / Avg. Operating Expense ratio at 14.79.
5. Enzon Pharmaceuticals Inc. (ENZN): Engages in the research and development of therapeutics for cancer patients with unmet medical needs. Net institutional shares sold during the most recent quarter at 3.3M shares (12.04% of float at 27.42M shares). Average quarterly operating expense over the last five quarters at $11.98M, vs. most recent cash and short term investments at $278.44M, implies a Cash / Avg. Operating Expense ratio at 23.23.
6. Rovi Corporation (ROVI): Provides digital entertainment technology solutions for the discovery and management of entertainment content. Net institutional shares sold during the most recent quarter at 6.0M shares (6.30% of float at 95.27M shares). Average quarterly operating expense over the last five quarters at $154.68M, vs. most recent cash and short term investments at $821.21M, implies a Cash / Avg. Operating Expense ratio at 5.31.
7. TD Ameritrade Holding Corporation (AMTD): Provides securities brokerage services and technology-based financial services to retail investors, traders, and independent registered investment advisors (RIA) in the United States. Net institutional shares sold during the most recent quarter at 14.7M shares (6.38% of float at 230.55M shares). Average quarterly operating expense over the last five quarters at $429.78M, vs. most recent cash and short term investments at $4945M, implies a Cash / Avg. Operating Expense ratio at 11.51.
8. Digital River Inc. (DRIV): Provides outsourced e-commerce solutions worldwide. Net institutional shares sold during the most recent quarter at 2.8M shares (9.64% of float at 29.05M shares). Average quarterly operating expense over the last five quarters at $94.56M, vs. most recent cash and short term investments at $675M, implies a Cash / Avg. Operating Expense ratio at 7.14.
9. Heelys, Inc. (HLYS): Designs, markets, and distributes action-sports-inspired products for 14-year-old boys and girls under the Heelys brand name. Net institutional shares sold during the most recent quarter at 1.1M shares (8.49% of float at 12.95M shares). Average quarterly operating expense over the last five quarters at $9.53M, vs. most recent cash and short term investments at $57.76M, implies a Cash / Avg. Operating Expense ratio at 6.06.
10. BroadSoft, Inc. (BSFT): Provides software that enables fixed-line, mobile, and cable service providers to deliver voice and multimedia services over Internet protocol (IP) based networks. Net institutional shares sold during the most recent quarter at 1.7M shares (6.19% of float at 27.48M shares). Average quarterly operating expense over the last five quarters at $32.13M, vs. most recent cash and short term investments at $177.56M, implies a Cash / Avg. Operating Expense ratio at 5.53.
11. Lam Research Corporation (LRCX): Engages in designing, manufacturing, marketing, and servicing semiconductor processing equipment used in the fabrication of integrated circuits. Net institutional shares sold during the most recent quarter at 21.4M shares (12.55% of float at 170.51M shares). Average quarterly operating expense over the last five quarters at $663.99M, vs. most recent cash and short term investments at $2724.23M, implies a Cash / Avg. Operating Expense ratio at 4.1.
12. QLogic Corp. (QLGC): Engages in the design and supply of storage networking, high performance computing networking, and converged networking infrastructure solutions. Net institutional shares sold during the most recent quarter at 9.7M shares (10.51% of float at 92.32M shares). Average quarterly operating expense over the last five quarters at $107.15M, vs. most recent cash and short term investments at $484.42M, implies a Cash / Avg. Operating Expense ratio at 4.52.
13. POZEN Inc. (POZN): Develops products for the treatment of acute and chronic pain, and other pain-related conditions in the United States. Net institutional shares sold during the most recent quarter at 3.0M shares (12.22% of float at 24.55M shares). Average quarterly operating expense over the last five quarters at $9.38M, vs. most recent cash and short term investments at $92.28M, implies a Cash / Avg. Operating Expense ratio at 9.84.
14. Sycamore Networks Inc. (SCMR): Develops and markets intelligent bandwidth management solutions for fixed line and mobile network operators worldwide. Net institutional shares sold during the most recent quarter at 2.0M shares (12.52% of float at 15.98M shares). Average quarterly operating expense over the last five quarters at $18.02M, vs. most recent cash and short term investments at $145.55M, implies a Cash / Avg. Operating Expense ratio at 8.08.
- English (UK)
- English (India)
- English (Canada)
- English (Australia)
- English (South Africa)
- English (Philippines)
- English (Nigeria)
- Deutsch
- Español (España)
- Español (México)
- Français
- Italiano
- Nederlands
- Português (Portugal)
- Polski
- Português (Brasil)
- Русский
- Türkçe
- العربية
- Ελληνικά
- Svenska
- Suomi
- עברית
- 日本語
- 한국어
- 简体中文
- 繁體中文
- Bahasa Indonesia
- Bahasa Melayu
- ไทย
- Tiếng Việt
- हिंदी
14 Cash-Rich Stocks Now Being Sold by Hedge Funds
Published 12/14/2012, 02:06 AM
Updated 07/09/2023, 06:31 AM
14 Cash-Rich Stocks Now Being Sold by Hedge Funds
Screen Criteria
3rd party Ad. Not an offer or recommendation by Investing.com. See disclosure here or
remove ads
.
Latest comments
Install Our App
Risk Disclosure: Trading in financial instruments and/or cryptocurrencies involves high risks including the risk of losing some, or all, of your investment amount, and may not be suitable for all investors. Prices of cryptocurrencies are extremely volatile and may be affected by external factors such as financial, regulatory or political events. Trading on margin increases the financial risks.
Before deciding to trade in financial instrument or cryptocurrencies you should be fully informed of the risks and costs associated with trading the financial markets, carefully consider your investment objectives, level of experience, and risk appetite, and seek professional advice where needed.
Fusion Media would like to remind you that the data contained in this website is not necessarily real-time nor accurate. The data and prices on the website are not necessarily provided by any market or exchange, but may be provided by market makers, and so prices may not be accurate and may differ from the actual price at any given market, meaning prices are indicative and not appropriate for trading purposes. Fusion Media and any provider of the data contained in this website will not accept liability for any loss or damage as a result of your trading, or your reliance on the information contained within this website.
It is prohibited to use, store, reproduce, display, modify, transmit or distribute the data contained in this website without the explicit prior written permission of Fusion Media and/or the data provider. All intellectual property rights are reserved by the providers and/or the exchange providing the data contained in this website.
Fusion Media may be compensated by the advertisers that appear on the website, based on your interaction with the advertisements or advertisers.
© 2007-2024 - Fusion Media Limited. All Rights Reserved.
