
Today I'm updating my monthly screen focusing on the cheapest dividend paying stocks on the capital market. I use six very strong criteria and only around a dozen companies remain each month.
My criteria for the cheap large cap screen are:
- Market Capitalization over USD 10 billion
- Expected Earnings per share growth over 10 percent for the next year.
- P/E ratio under 15
- P/S and P/B ratio under 2
- Positive Dividends
Twelve companies fulfilled the above mentioned criteria and ten of them have a current buy or better rating. One stock has a high yield (5 percent dividend yield or more). To buy cheap stocks is no guarantee for a return but you get value for what you pay and the possibility to overpay a stock is also low if the business model is stable.
BP (BP) has a market capitalization of $128.88 billion. The company employs 85,700 people, generates revenue of $388.285 billion and has a net income of $11.816 billion. BP’s earnings before interest, taxes, depreciation and amortization (EBITDA) amounts to $39.891 billion. The EBITDA margin is 10.27 percent (the operating margin is 5.08 percent and the net profit margin 3.04 percent).
Financial Analysis: The total debt represents 16.26 percent of BP’s assets and the total debt in relation to the equity amounts to 41.21 percent. Due to the financial situation, a return on equity of 10.07 percent was realized by BP. Twelve trailing months earnings per share reached a value of $8.07. Last fiscal year, BP paid $1.98 in the form of dividends to shareholders. The earnings of BP are expected to grow by 13.77 percent for the next year and 5.0 percent for the upcoming five years.
Market Valuation: Here are the price ratios of the company: The P/E ratio is 5.07, the P/S ratio is 0.33 and the P/B ratio is finally 1.10. The dividend yield amounts to 5.28 percent and the beta ratio has a value of 1.22.
Transocean (RIG) has a market capitalization of $16.64 billion. The company employs 18,400 people, generates revenue of $9.196 billion and has a net income of $816.00 million. Transocean’s earnings before interest, taxes, depreciation and amortization (EBITDA) amounts to $3.592 billion. The EBITDA margin is 39.06 percent (the operating margin is 17.21 percent and the net profit margin 8.87 percent).
Financial Analysis: The total debt represents 36.37 percent of Transocean’s assets and the total debt in relation to the equity amounts to 79.13 percent. Due to the financial situation, a return on equity of 5.15 percent was realized by Transocean. Twelve trailing months earnings per share reached a value of $4.58. Last fiscal year, Transocean paid no dividends to shareholders. The earnings of RIG are expected to grow by 37.51 percent for the next year and 26.09 percent for the upcoming five years.
Market Valuation: Here are the price ratios of the company: The P/E ratio is 10.07, the P/S ratio is 1.81 and the P/B ratio is finally 1.05. The dividend yield amounts to 4.85 percent and the beta ratio has a value of 1.25.
Freeport-McMoRan Copper & Gold (FCX) has a market capitalization of $32.54 billion. The company employs 34,000 people, generates revenue of $18.010 billion and has a net income of $3.977 billion. Freeport-McMoRan Copper & Gold’s earnings before interest, taxes, depreciation and amortization (EBITDA) amounts to $6.927 billion. The EBITDA margin is 38.46 percent (the operating margin is 31.35 percent and the net profit margin 22.08 percent).
Financial Analysis: The total debt represents 9.95 percent of Freeport-McMoRan Copper & Gold’s assets and the total debt in relation to the equity amounts to 20.10 percent. Due to the financial situation, a return on equity of 18.33 percent was realized by Freeport-McMoRan Copper & Gold. Twelve trailing months earnings per share reached a value of $2.81. Last fiscal year, Freeport-McMoRan Copper & Gold paid $1.25 in the form of dividends to shareholders. The earnings of FCX are expected to grow by 30.49 percent for the next year and 7.60 percent for the upcoming five years.
Market Valuation: Here are the price ratios of the company: The P/E ratio is 11.15, the P/S ratio is 1.81 and the P/B ratio is finally 1.70. The dividend yield amounts to 3.99 percent and the beta ratio has a value of 1.98.
Take a look at the full list of cheap large capitalized stocks with highest expected earnings per share growth. The average P/E ratio amounts to 11.16 while the forward P/E ratio is 9.17. P/S ratio is 0.78 and P/B ratio 1.25. The expected earnings growth for next year amounts to 20.57 and 10.20 percent for the upcoming five years.
Here is the full table with some fundamentals (TTM): 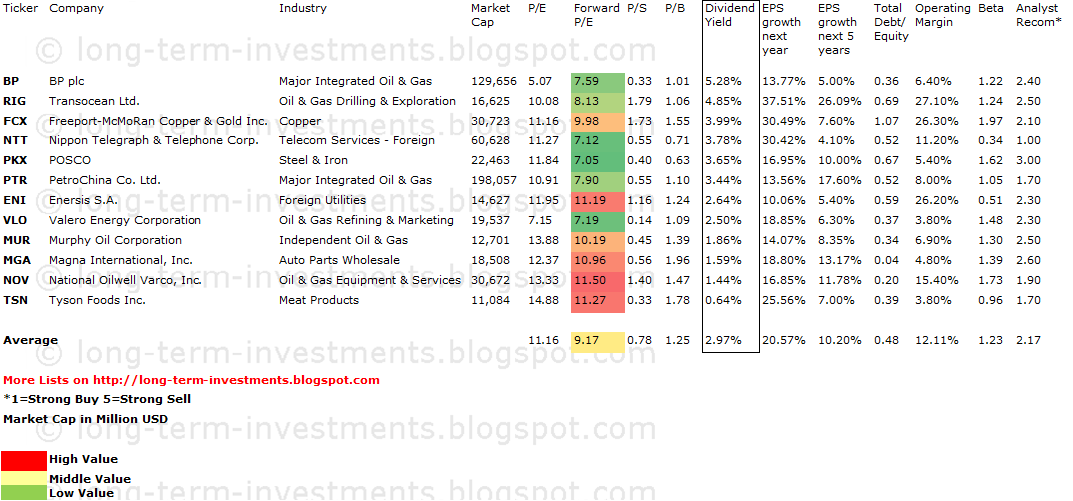
Related stock ticker symbols:
BP, RIG, FCX, NTT, PKX, PTR, ENI, VLO, MUR, MGA, NOV, TSN
Disclosure: I have no positions in any stocks mentioned, and no plans to initiate any positions within the next 72 hours. I receive no compensation to write about any specific stock, sector or theme.
- English (UK)
- English (India)
- English (Canada)
- English (Australia)
- English (South Africa)
- English (Philippines)
- English (Nigeria)
- Deutsch
- Español (España)
- Español (México)
- Français
- Italiano
- Nederlands
- Português (Portugal)
- Polski
- Português (Brasil)
- Русский
- Türkçe
- العربية
- Ελληνικά
- Svenska
- Suomi
- עברית
- 日本語
- 한국어
- 简体中文
- 繁體中文
- Bahasa Indonesia
- Bahasa Melayu
- ไทย
- Tiếng Việt
- हिंदी
12 Cheapest Dividend Paying Large Caps: August 2013
Published 08/23/2013, 06:48 AM
Updated 07/09/2023, 06:31 AM
12 Cheapest Dividend Paying Large Caps: August 2013
Latest comments
Loading next article…
Install Our App
Risk Disclosure: Trading in financial instruments and/or cryptocurrencies involves high risks including the risk of losing some, or all, of your investment amount, and may not be suitable for all investors. Prices of cryptocurrencies are extremely volatile and may be affected by external factors such as financial, regulatory or political events. Trading on margin increases the financial risks.
Before deciding to trade in financial instrument or cryptocurrencies you should be fully informed of the risks and costs associated with trading the financial markets, carefully consider your investment objectives, level of experience, and risk appetite, and seek professional advice where needed.
Fusion Media would like to remind you that the data contained in this website is not necessarily real-time nor accurate. The data and prices on the website are not necessarily provided by any market or exchange, but may be provided by market makers, and so prices may not be accurate and may differ from the actual price at any given market, meaning prices are indicative and not appropriate for trading purposes. Fusion Media and any provider of the data contained in this website will not accept liability for any loss or damage as a result of your trading, or your reliance on the information contained within this website.
It is prohibited to use, store, reproduce, display, modify, transmit or distribute the data contained in this website without the explicit prior written permission of Fusion Media and/or the data provider. All intellectual property rights are reserved by the providers and/or the exchange providing the data contained in this website.
Fusion Media may be compensated by the advertisers that appear on the website, based on your interaction with the advertisements or advertisers.
© 2007-2024 - Fusion Media Limited. All Rights Reserved.