
If 2017 was all about the stock market, it is starting to look as though the early parts of 2018 maybe prove to be the precious metals space. The SPDR Gold Trust ETF (P:GLD (NYSE:GLD)) is already up more than 12.5% on a YTD basis, and on its way to breaking some incredibly important resistance levels on the daily charts.
Is this a harbinger of things to come? A confluence of fundamental and technical events suggests that we could still be in the early stages of a major bull rally in gold markets that may not show signs of stalling until the second half of this year.
Chart: SPDR Gold Trust ETF Daily Chart
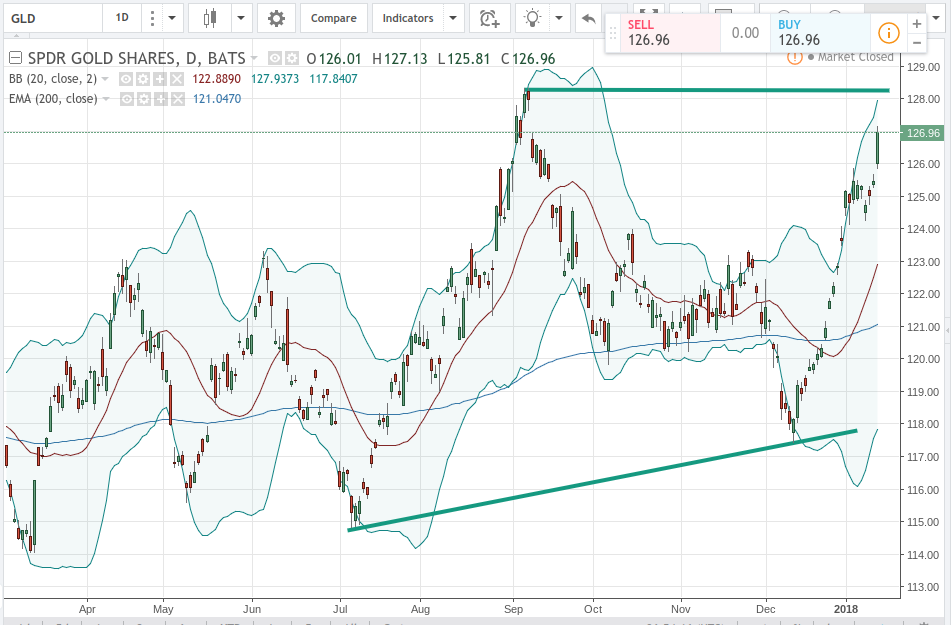
In this chart, we can start to see the longer term scope of the rallies as they have left overbought indicator readings on many of the most commonly watched trading charts. But the real question here is whether or not there is sufficient momentum in the market to break through critical historical resistance at 128.30. This would also signal a strong possibility that the multi-year declines from previous all-time highs in GLD have also completed within the cyclical nature of the gold price history. This supports the outlook for options strategies that benefit from broader rallies in the precious metals complex.
Since we are coming into very important market levels, there is scope for increased volatility if a larger number of buyers and sellers have placed orders near 128.30 in the gold exchange traded fund. A break higher will be a highly bullish event and signal that a long-term bottom would be in place near 117.80.
Peripheral factors like interest rates could also prove to be supportive if the new head of the Federal Reserve assumes the policy stance of the previous regime under Janet Yellen. Lower interest rates tend to be positive for precious metals, and this could give markets the added fuel they need to break these resistance levels resting higher.