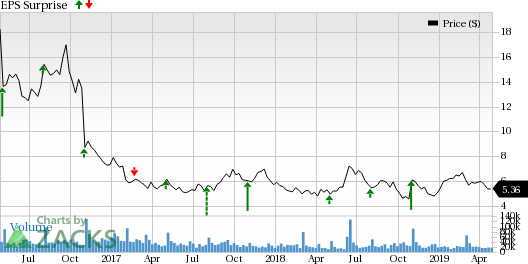
Fitbit Inc. (NYSE:FIT) is set to report first-quarter 2019 results on May 1. Notably, it surpassed the Zacks Consensus Estimate in all the trailing four quarters, recording average positive surprise of 155.83%.
In the last reported quarter, Fitbit recorded adjusted earnings of 14 cents per share, surpassing the Zacks Consensus Estimate by 7 cents.
Revenues of $571.2 million increased 0.1% year over year and 45.1% on a sequential basis. Moreover, the top line was ahead of management’s guidance of $560 million and surpassed the consensus mark of $567.7 million.
Management remains optimistic about smartwatch sales and expects to increase its market share in this space in the coming quarters.
Let’s see how things are shaping up for this announcement.
Growth Drivers
The company’s robust and expanding product portfolio is expected to continue aiding its momentum in the fitness wearables market. Fitbit’s product introductions and sustained focus on health and wellness sector are expected to aid first-quarter results.
In the first quarter, the company unveiled Versa Lite that will help users track their health like the earlier released Versa. In addition, the company announced new versions of cheaper trackers including the Fitbit HR, capable of tracking heart rate, and Ace 2, which can track activity in children.
During the quarter, the company also partnered with Arizona-based Solera Health in order to help people improve health culture and reduce type 2 diabetes.
The latest efforts will aid its top-line growth in the to-be-reported quarter.
We believe its strong efforts toward improvement of software and services for offering more personalization to customers, as well as achieving greater integration into the healthcare ecosystem are major positives.
All these strong endeavors are expected to aid first-quarter results.
Device Strength
Fitbit sold 5.6 million devices in the fourth quarter, up up 3% year over year. New products launched over the past 12 months contributed 79% to the company’s revenues.
For the to-be-reported quarter, Fitbit expects to sell million of new devices, which is remarkable. The recently launched low-cost fitness wearables are anticipated to benefit the company’s first-quarter revenues.
Increasing Competition a Concern
Fitbit, which became a prominent name for simple fitness wearables, has been hurt by massive competition in the market. It faces competition in both high and low-end product range. The company competes with Apple (NASDAQ:AAPL) Watch on the high-end front. On the lower end, fitness-tracking devices from Jawbone, Garmin Ltd. (NASDAQ:GRMN) and Xiaomi pose tough competition.
View
For first-quarter 2019, Fitbit expects revenues in the range of $250-$268 million, indicating an increase of 1-8% on a year-over-year basis. The Zacks Consensus Estimate for the same is pegged at $259.9 million.
What Our Model Says
According to the Zacks model, a company with a Zacks Rank #1 (Strong Buy), 2 (Buy) or 3 (Hold) has a good chance of beating estimates if it also has a positive Earnings ESP. You can uncover the best stocks to buy or sell before they’re reported with our Earnings ESP Filter.
Currently, Fitbit has a Zacks Rank #3 and an Earnings ESP of 0.00%, which does not indicate a likely positive earnings surprise. Sell-rated stocks (Zacks Rank #4 or 5) are best avoided.
Stocks to Consider
Here are some stocks that you may want to consider, as our model shows that these have the right combination of elements to post an earnings beat in the to-be-reported quarter.
Teleflex Incorporated (NYSE:TFX) has an Earnings ESP of +1.65% and holds a Zacks Rank #2.
Square, Inc. (NYSE:SQ) has an Earnings ESP of +5.50% and a Zacks Rank #2. You can see the complete list of today’s Zacks #1 Rank stocks here.
Triton International Limited (NYSE:TRTN) has an Earnings ESP of +2.51% and holds a Zacks Rank #3.
Today's Best Stocks from Zacks
Would you like to see the updated picks from our best market-beating strategies? From 2017 through 2018, while the S&P 500 gained +15.8%, five of our screens returned +38.0%, +61.3%, +61.6%, +68.1%, and +98.3%.
This outperformance has not just been a recent phenomenon. From 2000 – 2018, while the S&P averaged +4.8% per year, our top strategies averaged up to +56.2% per year.
See their latest picks free >>
Triton International Limited (TRTN): Free Stock Analysis Report
Square, Inc. (SQ): Free Stock Analysis Report
Fitbit, Inc. (FIT): Free Stock Analysis Report
Teleflex Incorporated (TFX): Free Stock Analysis Report
Original post

