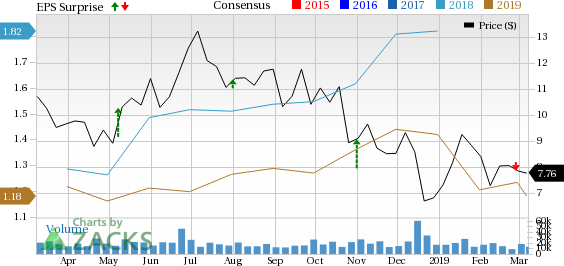
Gulfport Energy Corporation (NASDAQ:GPOR) recently came up with mixed results in fourth-quarter 2018, with the bottom line lagging estimates and the top line surpassing the same. The Oklahoma-based company reported fourth-quarter adjusted net income per share of 46 cents, missing the Zacks Consensus Estimate of 49 cents amid high costs. The figure was just a penny above the prior-year figure.
Revenues of $416 million surpassed the Zacks Consensus Estimate of $380 million. The top line also improved from the year-ago figure of $397.8 million.
Production Rises
Gulfport’s total oil and gas production increased to 1,392.8 million cubic feet equivalent per day (MMcfe/d) from 1,263.3 MMcfe/d recorded in the corresponding period of last year. Of the total output, 90.8% comprised natural gas.
The company recorded improved year-over-year production from Utica and SCOOP plays during the quarter. Output from Utica and SCOOP totaled 102,665 MMcfe and 24,406 MMcfe, respectively, in the fourth quarter of 2018. Nearly 88.1% of its output came from the Utica acreage.
Higher Realized Prices
Average realized natural gas oil price (before the impact of derivatives) during the fourth quarter was $3.16 per thousand cubic feet, higher than the year-ago period’s $2.32. However, average realized natural gas liquids price was 67 cents per gallon, down from the year-ago quarter’s 76 cents. Gulfport fetched $58.45 per barrel of oil during the quarter, up from the year-ago figure of $53.71. Overall, Gulfport realized $3.45 per thousand cubic feet equivalent in the quarter vis a vis $2.80 in the year-ago period.
Expenses
Total expenses in the quarter under review amounted to $261.3 million, reflecting an increase of 16.2% from $224.8 million in the prior-year period. This is mainly attributed to higher production taxes, depreciation and midstream gathering/processing charges incurred in the reported quarter.
Depreciation costs rose 22% to $133.8 million and midstream gathering/processing expenses scaled up 4% from the prior-year quarter to $75.6 million.
Capex, Balance Sheet & Stock Buyback
In the reported quarter, Gulfport spent $63.5 million on drilling and completion (D&C). Full-year D&C capex amounted to $695.4 million. As of Dec 31, 2018, the natural gas-weighted energy explorer had approximately $52.3 million in cash and cash equivalents. Gulfport had a long-term debt of $2,086.7 million, representing a debt-to-capitalization ratio of around 38.5%.
With the company having completed its $200 million worth share buyback program in 2018, Gulfport authorized the repurchase of an additional $400 million of shares of the company’s common stock over the next two years.
2019 Guidance Retained
Gulfport reiterated its 2019 guidance that was unveiled in January. The upstream player expects 2019 capex in the band of $565-$600 million. The company projects 2019 production within 1,360-1,400 MMcfe/d. Moreover, the company expects free cash flow to exceed $100 million.
Zacks Rank & Key Picks
Gulfport currently carries a Zacks Rank #3 (Hold).
Meanwhile, some better-ranked players in the energy space include ProPetro Holding Corp. (NYSE:PUMP) , Archrock, Inc. (NYSE:AROC) and NuStar Energy L.P. (NYSE:NS) , each carrying a Zacks Rank #2 (Buy).
You can see the complete list of today’s Zacks #1 Rank (Strong Buy) stocks here.
The 2019 Zacks Consensus Estimate for ProPetro is $2.21, representing 10.6% earnings per unit growth over 2018. Next year’s average forecast is $2.52, pointing to another 13.9% growth.
The 2019 Zacks Consensus Estimate for Archrock is pegged at 67 cents, representing 38.9% earnings per unit growth over 2018. Next year’s average forecast is 73 cents, pointing toward another 10% growth.
The 2019 Zacks Consensus Estimate for NuStar is $1.10, representing 63.9% earnings per unit growth over 2018. Next year’s average forecast is $1.16, pointing to another 6% growth.
Today's Best Stocks from Zacks
Would you like to see the updated picks from our best market-beating strategies? From 2017 through 2018, while the S&P 500 gained +15.8%, five of our screens returned +38.0%, +61.3%, +61.6%, +68.1%, and +98.3%.
This outperformance has not just been a recent phenomenon. From 2000 – 2018, while the S&P averaged +4.8% per year, our top strategies averaged up to +56.2% per year.
See their latest picks free >>
NuStar Energy L.P. (NS): Free Stock Analysis Report
Archrock, Inc. (AROC): Free Stock Analysis Report
Gulfport Energy Corporation (GPOR): Free Stock Analysis Report
ProPetro Holding Corp. (PUMP): Free Stock Analysis Report
Original post
Zacks Investment Research

