The equity rebound may have run its course as the S&P 500 faces numerous technical hurdles, reports Fawad Razaqzada, Technical Analyst FOREX.com.
The U.S. equity markets have started 2019 with a bang, but that good run of form could be about to end. Global stock indices were trading lower this morning, with U.S. index futures also pointing to a lower open on Wall Street when trading gets underway there later. Profit-taking is of course one reason for the weakness in equities today, given the extent of the recent rebound and especially since this week has been very quiet in terms of news flow and data. Investors are also concentrating on other macro events until the focus returns to Brexit when the UK Prime Minister lays out her plan B, by Monday latest.
One area of major concern for investors is weakness in China, where the economic growth has slowed down to 6.5%, the slowest pace since 2009. The slowdown of growth in the world’s second largest economy has been in part due to its trade dispute with the United States, with the latter raising its import tariffs on Chinese goods amid accusations of intellectual property theft and unfair trade practices. Although the two nations have started to work on resolving their disputes – which may explain the recent equity market rebound – cracks have nonetheless started to appear in China, with demand for high-end luxury goods, for example, falling. Car sales fell last year for the first time in more than 20 years, while Apple’s warning a couple of weeks ago about weak sales of its iPhone in China is another example.
The damage may have already been done and this could have a negative trickledown effect on the rest of the world, including the U.S. economy. So, while a potential trade resolution could help to prop up the markets, when and if it happens, it could prove to be short-lived as by then the news may have already been priced in. And while the fourth quarter U.S. earnings results have so far been somewhat more positive than negative, bigger and more important companies will be publishing their results and their numbers and outlook could reflect our and other economists’ concerns about China.
Macro view: S&P 500 hits key long-term resistance zone
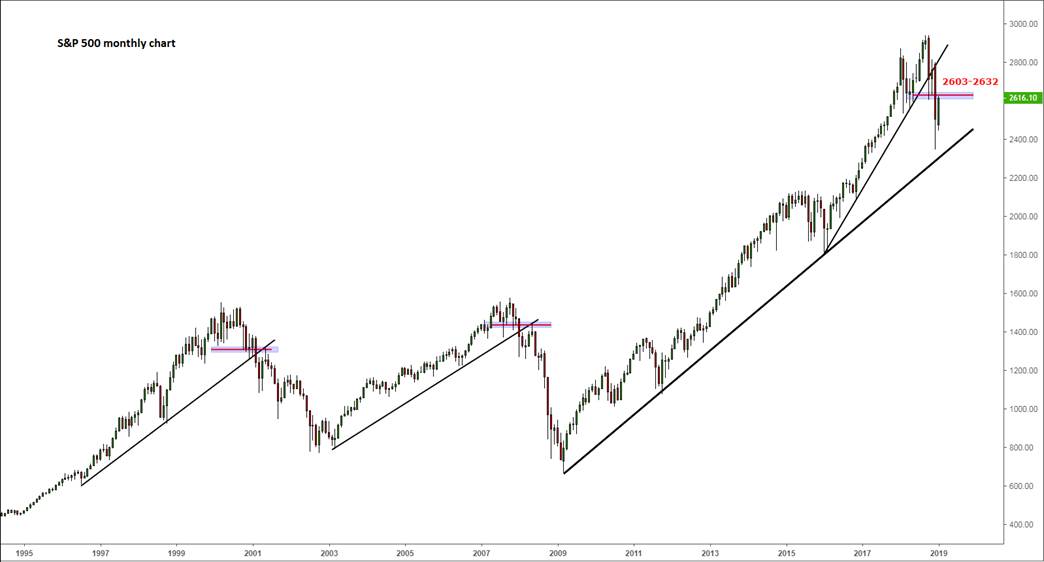
Meanwhile, from a technical point of view, the global and U.S. stock markets may have already peaked last year, with the major global indices, including the S&P 500, breaking key support levels and forming repeated lower lows and lower highs. So, I wouldn’t be surprised if we do now see a sizeable pullback here after the recent recovery. For one thing, the S&P 500 looks overbought in the short-term outlook, especially in light of the big falls we witnessed at the back end of last year. The index is now retesting the key broken support zone in the 2603-2632 range, as can be seen on the monthly time frame (see chart below). The index has already met with some resistance within this zone yesterday, turning lower from around 2625. If the sell-off at the end of last year marked the end of the bull trend, then this is where the next phase of the selling could potentially start.
Source: TradingView and FOREX.com
Bears need breakdown
Although, as mentioned, the index has now reached a massive area of potential resistance, we must first see a clean breakdown in the lower time frame charts before we turn bearish again. On the daily time frame, one can clearly observe that the most recent low, prior to the latest up move was made at 2567 on Monday. It is therefore this 2567 level that now needs to break for the index to create a lower low. Should this happen, then we could see another sharp sell-off that could potentially move the index, over time, below the 2018 low of 2315. However, there will be other key shorter-term levels, for example at 2521 and 2492, that could prevent that from happening.
Nonetheless, a break below that 2567 would tip the balance back in bears’ favor. For the bulls meanwhile, a clean break through the abovementioned long-term resistance in the 2603-2632 range is needed if we are to see further gains in the near-term outlook. Given the above technical and fundamental considerations, we are doubtful that this scenario will play out. But of course, we could be reading it all wrong. So, let’s let the charts tell us what the next directional move will be, rather than pre-empting it.
Source: TradingView and FOREX.com