By Amanda Cooper, Yoruk Bahceli and Naomi Rovnick
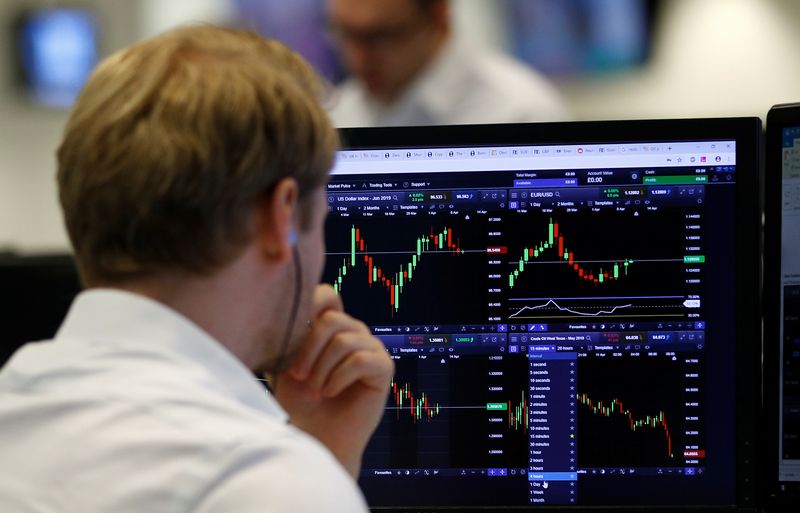
LONDON (Reuters) - Financial market stress indicators reacted sharply on Monday after the failure of three U.S. banks within five days, which prompted a rethink among investors on the outlook for U.S. rates and triggered the biggest rush into bonds since at least 2008.
State regulators closed New York-based Signature Bank (NASDAQ:SBNY) on Sunday, two days after California authorities shuttered Silicon Valley Bank, a lender that focused predominantly on start-ups. Crypto-focused bank Silvergate said last week it would also have to wind down its operations.
SVB is the largest bank to fail since the 2008 financial crisis last week, sending shockwaves across global markets.
U.S. regulators stepped in over the weekend to guarantee the deposits of SVB, but this did little to reassure investors that there will be no more fallout.
Investors reeled in their expectations for global central bank rate hikes, and bank stocks tumbled once again.
The cost of insuring exposure to European junk bonds soared to two-month highs, while various gauges of equity and bond market volatility shot to their highest since October and even gold hit a six-week peak.
"I would define the moves we're having today as an old-fashioned flight to quality, this is what normally happens in times of stress. Credit spreads widen, equity markets come off and safe havens provide capital appreciation," Juan Valenzuela, a bond fund manager at Artemis, said.
(Graphic: Moving higher - https://www.reuters.com/graphics/MARKETS-VOLATILITY/myvmoaeqyvr/chart.png)
In the money markets, a closely watched indicator of credit risk in the U.S. banking system edged up on Monday, as did other indicators of credit risk in the euro zone.
The so-called FRA-OIS spread, which measures the gap between the U.S. three-month forward rate agreement and the overnight index swap rate, edged to its widest since Feb. 21, to 11.4 basis points. This spread is widely seen as a proxy for banking sector risk and a higher reading reflects rising interbank lending risk.
"It'd be unrealistic to think that banks aren't being more discerning about who they're going to lend money to," said Lyn Graham-Taylor, senior rates strategist at Rabobank.
U.S. banking stocks came under fire in early trading. An index of major bank shares dropped by as much as 8.7%, in one of the largest one-day falls since the onset of the COVID-19 crisis in March 2020.
“If banks start to be more cautious and credit standards tighten a lot more, that drives more risk of recession down the road," Frederik Ducrozet, head of macroeconomic research at Pictet Wealth Management, said.
"The more immediate risk is from the U.S., but in both (regions) we have quarterly surveys that show banks are already planning to tighten credit standards. Now we have more risk that this tightening becomes disorderly at some point," he said.
European banks were heading for their largest one-day slide in a year as well, down over 5%.
Euro swap spreads, another risk gauge, widened sharply.
The gap between two-year euro swap rates and two-year German bond yields widened by around 20 basis points to 83 basis points, to the highest since Nov. 11.
Analysts said that was a result of strong demand for safe-haven bonds.
A swap spread measures the premium on the fixed-leg of an interest rate swap, used by investors to hedge against rates risk, relative to bond yields.
(Graphic: Signs of stress - https://www.reuters.com/graphics/MARKETS-SWAPS/gkplwlrmxvb/chart.png)
In Germany, two-year bond yields were last down over 40 basis points, much more than a drop of 24 basis points on swap rates.
Cross-currency basis swaps, a measure of non-U.S. investor demand for the dollar, another safe-haven, reached their widest in three years.
Three-month euro swaps reached minus 65 bps, the most since March 2020. Back in late 2008, when failed investment bank Lehman Brothers collapsed, this swap rate went as negative as 300 bps.
As dramatic as some of the moves in bond and stock prices were on Monday, analysts agreed that it was unlikely to be a function of direct contagion from SVB, but rather, more driven by sentiment.
"This move we're seeing right now is more of a stress indication than anything else," Piet Christiansen, chief analyst at Danske Bank, said.
(Graphic: Seismic shift in Fed expectations - https://www.reuters.com/graphics/MARKETS-FUTURES/egpbyorzdvq/chart.png)