Get 40% Off
🤯 Perficient is up a mind-blowing 53%. Our ProPicks AI saw the buying opportunity in March.Read full update

History shows strong 2023 could keep US stocks on path for 2024 gains

Published 12/29/2023, 02:09 PM
Updated 12/29/2023, 08:35 PM
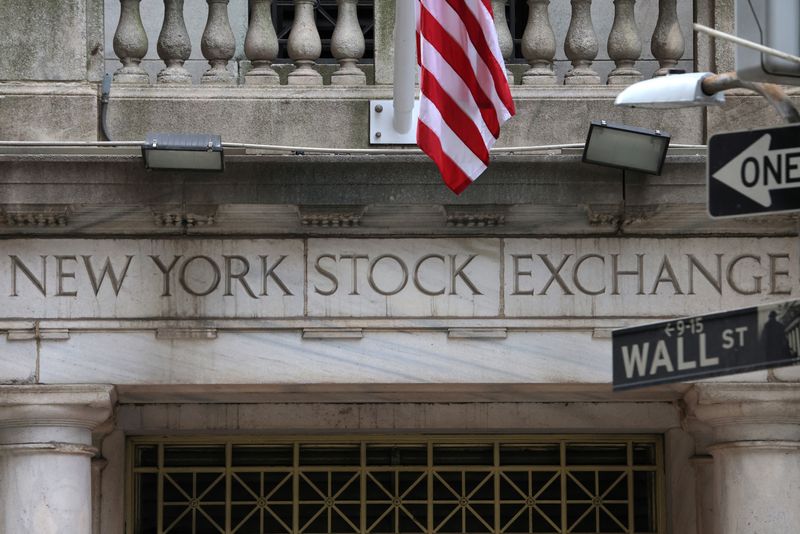
© Reuters. FILE PHOTO: Signage is seen at the New York Stock Exchange (NYSE) in Manhattan, New York City, U.S., November 11, 2022. REUTERS/Andrew Kelly/File Photo

By Lewis Krauskopf

NEW YORK (Reuters) -The U.S. stock market’s hefty gains in 2023 could provide a lift for equities next year, if history is any guide.

The S&P 500 ended the year on Friday with an annual gain of just over 24%. The benchmark index also stood near its first record closing high in about two years.

Market strategists who track historical trends say that such a strong annual performance for stocks has often carried over into the following year, a phenomenon they attribute to factors including momentum and solid fundamentals.

"What we continue to come back to is solid gains for next year," said Adam Turnquist, chief technical strategist at LPL Financial (NASDAQ:LPLA). "Maybe we will have a little bit of short-term pain but the long-term gain is definitely there when we look at the data.”

Stocks built up a head of steam in 2023, with the S&P 500 up 11% in the fourth quarter alone. This could translate to strength in the new year.

Data from LPL Research going back to 1950 showed that years following a gain of 20% or more have seen the S&P 500 rise an average of 10%. That compares to an average 9.3% annual return. Such years are also more frequently positive, with the market ending the year up 80% of the time, versus 73% overall.

“Momentum begets momentum,” Turnquist said. “I also believe themes that are capable of driving a market up (at least) 20% are typically durable trends persisting beyond a calendar year.”

3rd party Ad. Not an offer or recommendation by Investing.com. See disclosure here or remove ads .

LPL Research has a 2024 year-end target range for the S&P 500 of 4,850 to 4,950, but the firm sees potential upside above 5,000 if lower interest rates support higher valuations, companies achieve double-digit earnings growth and the U.S. economy avoids recession. The index was last at 4,769.83.

Investor hopes for an economic soft landing will get an early test next Friday, with release of the monthly U.S. employment report.

Ryan Detrick, chief market strategist at Carson Group, notes that stocks have seen strong gains after rebounding from steep drawdowns. Since 1950, there have been six times when the S&P 500 rebounded by at least 10% after falling 10% or more the previous year. Each time the index’s bounce continued for a second year, returning an average of 11.7%, Detrick’s data showed. The S&P 500 tumbled over 19% in 2022.

Detrick noted the data as part of a recent commentary on why 2024 "should be a good one for the bulls."

Reaching a record high could be another bullish sign for stocks. Since 1928, there have been 14 instances of a gap of at least one year between S&P 500 all-time highs, according to Ed Clissold, chief U.S. strategist at Ned Davis Research. The S&P 500 went on to rise an average of 14% a year after a new high was reached, rising 13 of 14 times, according to Clissold.

Further tests of the market's strength will arrive quickly. U.S. companies start to report fourth-quarter results in the next couple of weeks with investors anticipating a much stronger year for profit growth in 2024 after a tepid 3.1% increase in 2023 earnings, according to the latest LSEG estimates.

3rd party Ad. Not an offer or recommendation by Investing.com. See disclosure here or remove ads .

Investors are also awaiting the conclusion of the Fed’s first monetary policy meeting of the year in late January for insight into whether policymakers hew to the dovish pivot they signaled in late December, penciling in 75 basis points of rate cuts for 2024.

Indeed, signs the economy is starting to wobble following the 525 basis points in Fed rate hikes since 2022 could hinder momentum for stocks. By the same token, accelerating inflation in 2024 could delay expected rate cuts, putting the market’s soft-landing hopes on hold.

"History is a great guide, but never gospel, and I think we have to acknowledge that," said Sam Stovall, chief investment strategist at CFRA.

However, data Stovall looks at foreshadows a solid 2024, including history regarding presidential election years. The S&P 500 has gained all 14 times in the year that a president has sought re-election, regardless of who wins, with an average total return of 15.5%, according to Stovall.

"Basically, all of the indicators that I look at point to a positive year," Stovall said.
Latest comments

for the past 3 years I am doing great being 85%+ invested in stocks at the start of 2021. very nice 3 year performance BTW. thanks
History also said a recession is coming in 2023, something strange better happen in less than 24 hrs
As I said, history can be presented in many ways.   Of course the idea of recession in 2023 was quite much related  to the fact that the higher intrest rates would slow the economy. Accoridig to US statics it did not happen ( I am bit skeptic of US statics as the subprime crisis got so huge due to US statics which were later on " corrected " ).  But iin looking year 2024 the big questions in stocks markets are following:     1. Will the soft landing really happen      2. How much the intrest rates will be lowered, so will rates be 1n end of year 2024 lower than 4 % or not.        3 What is the pace of lowering intrest rates, so are markets expecting too much lowerins in too quick pace or not       4. As on 2020´s every paired year has been a year of crisis and impaired years as years of recovery, will history repeat itself in year 2024 with a big crisis ( Ukraina war expanding to a nuke war or not, US presidential elections processed in peaceful way, Middle East crisis expanding etc ).
Before year 2023 so in year 2022 S&P 500 tumbeled over 19 % due to higher intrest rates. The difference in S&P 500 was between last market day 2021 and 2023 only around 3 points, less than one promille gain.  Hence you could sell your S&P 500 etf:s in last market day 2021 and buy those back in the last market day of 2023 without loosing pretty much anything. And in year 2021 S&P 500 gained almost 27 %, then next year 2022 it tymbled down over 19 %. So history can be presented in many ways. Year 2021 higher gains than year 2023 in S&P 500 did not predict how year 2022 went.    In the last quarter of 2023 the gains in S&P 500 were pretty much due to expectations of lower intrest rates. Lower intrest rates are not a signal of boosting economy, on the contrary.  So year 2023 might not predict very much the year 2024 with S&P 500, eventhough it is hoped that there will be so called soft landing in US economy. The rise of S&P 500 will be maybe much moderate in year 2024 than year 2023.
And there will be those guys complaining. Saying this is a fraud and so on instead of making money
Lol 🎥🤣🤡
trap 🤦
why do you say is a trap
history lol four scores and seven years ago..
LOL. Continuation of the fraud articles. Oh boy.
Did you take a look at 1929 in your historical analysis?
Risk Disclosure: Trading in financial instruments and/or cryptocurrencies involves high risks including the risk of losing some, or all, of your investment amount, and may not be suitable for all investors. Prices of cryptocurrencies are extremely volatile and may be affected by external factors such as financial, regulatory or political events. Trading on margin increases the financial risks.
Before deciding to trade in financial instrument or cryptocurrencies you should be fully informed of the risks and costs associated with trading the financial markets, carefully consider your investment objectives, level of experience, and risk appetite, and seek professional advice where needed.
Fusion Media would like to remind you that the data contained in this website is not necessarily real-time nor accurate. The data and prices on the website are not necessarily provided by any market or exchange, but may be provided by market makers, and so prices may not be accurate and may differ from the actual price at any given market, meaning prices are indicative and not appropriate for trading purposes. Fusion Media and any provider of the data contained in this website will not accept liability for any loss or damage as a result of your trading, or your reliance on the information contained within this website.
It is prohibited to use, store, reproduce, display, modify, transmit or distribute the data contained in this website without the explicit prior written permission of Fusion Media and/or the data provider. All intellectual property rights are reserved by the providers and/or the exchange providing the data contained in this website.
Fusion Media may be compensated by the advertisers that appear on the website, based on your interaction with the advertisements or advertisers.
© 2007-2024 - Fusion Media Limited. All Rights Reserved.