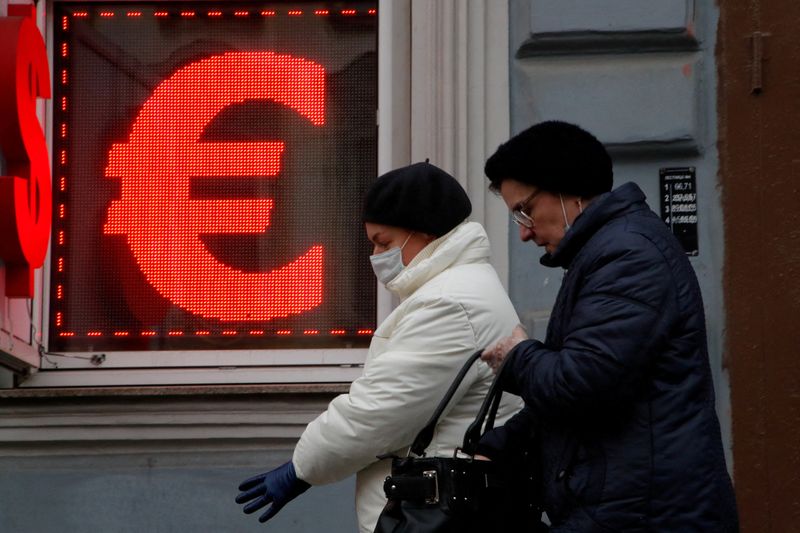
LONDON (Reuters) - Russia's escalating war in Ukraine has sent commodity and energy prices soaring, boosted safe havens and hammered Europe's common currency and its stock markets.
Below are six charts showing the recent dramatic market moves:
EURO IN THE DOLDRUMS
The euro fell below $1.10 on Friday for the first time in almost two years, having shed over 3% against the dollar this week for its biggest weekly fall since March 2020.
The single currency was nursing even bigger losses against the Swiss franc. It is down almost 4% over the week in its biggest such fall since January 2015, when Switzerland abandoned the franc's three-year-old cap against the euro.
Worries that Russia's invasion of Ukraine will deal the economy a fresh blow, especially as energy prices soar, explain why the currency is one of the week's biggest losers. Graphic: The euro takes a beating, https://fingfx.thomsonreuters.com/gfx/mkt/akvezxnlepr/euroforkarin.PNG
GRAINS & METALS
Prices of raw materials from wheat to various metals have soared to multi-year highs as Western sanctions have disrupted air and sea shipments of commodities produced and exported by Russia.
Russia and Ukraine are two of the world's biggest exporters of wheat, which scaled a 14-year peak on Friday, having gained nearly 40% since Russia invaded Ukraine on Feb. 24.
Russia is also a supplier of metals. Aluminium hit a record high on Friday while copper, where the country supplies 3.5% of world supplies, was also flirting with a fresh all-time peak.
Graphic: Grains and metals, https://fingfx.thomsonreuters.com/gfx/mkt/lgpdwaakxvo/Wheat%20and%20commodity%20prices.PNG ENERGY & GAS
Brent crude prices rose another 21% over the week, closing at their highest since 2013, with buyers and shippers increasingly shunning Russian oil supplies which total up to five million barrels per day (bpd).
Neither the possibility of a million bpd of Iranian crude coming on tap in case of a revived nuclear deal with the West nor developed countries' deal for a coordinated release of 60 million barrels made a dent.
European gas prices notched an astonishing 120% weekly gain, to hit 208 euros per megawatt hour -- a record high. Graphic: Brent crude and European gas prices, https://fingfx.thomsonreuters.com/gfx/mkt/lbpgnzzgjvq/Brent%20crude%20and%20European%20gas%20prices.PNG
EUROPEAN BANKS PUNISHED
European banks had another gruelling week, hit by a triple whammy of Western sanctions on Russia, a scaling back of rate hike expectations and a worsening macroeconomic environment.
The moves reverse all the gains made earlier this year when it appeared that economic recovery would allow central banks to raise interest rates, benefiting banks.
A European banking stocks index fell around 16%, its worst week since March 2020, bringing year-to-date losses to 20%. Shares in Russia-exposed lenders such as Austria's Raiffeisen and France's SocGen fell around a third over the week. Graphic: European banking stocks down over 16% this week, https://fingfx.thomsonreuters.com/gfx/mkt/gdvzybngwpw/banks%20for%20karin.PNG
LOVING BUNDS
Turmoil in European markets, heightened uncertainty over the economic outlook and a scaling back of rate-hike bets meant investors were keen to snap up safe-haven bonds.
In Germany -- the euro area's benchmark bond issuer -- 10-year bond yields fell 30 bps this week in their biggest one-week fall since the euro debt crisis in 2011.
At -0.08%, German Bund yields are back in negative yield territory. In other words, investors are willing to pay Germany's government to hold its bonds in an uncertain environment. That was not the case a week ago, when Bund yields stood at 0.22%. Graphic: Bund yields below zero, https://fingfx.thomsonreuters.com/gfx/mkt/zgpomzjqrpd/Bund%20yields%20back%20below%20zero.PNG
ROUBLE DISCONNECT
Russia's rouble has tumbled more than 30% in offshore trade - its worst week on record - and around 20% in Moscow trade. Bid-ask spread are very wide - a sign of evaporating liquidity.
The divergence between onshore and offshore trade illustrates just how disconnected Russia has become from global financial markets after severe sanctions and countermeasures. Graphic: Russia rouble disconnect, https://fingfx.thomsonreuters.com/gfx/mkt/klvykbbgjvg/Russia%20rouble%20onshore%20and%20offshore.PNG
