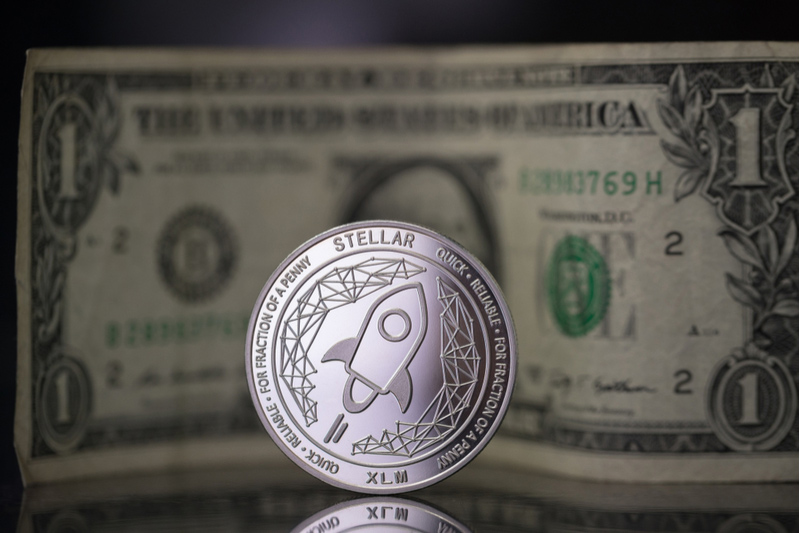
- Stellar (XLM) signals red after falling from the past day’s high of $0.1124.
- XLM is registered at $0.1111 at press time.
- All major coins, except DOGE, have dipped in the past 24 hours.
The crypto market showed a red flag in the past 24 hours with a market cap of $1.02 trillion, a 0.6% down. Stellar (XLM), which ranks 26 in the market cap, is currently clocked at $0.1111, with a 0.55% dip.
However, Dogecoin (DOGE) is 14.06% up in the past 24 hours. This price surge happened after Elon Musk tweeted a picture of a dog wearing a t-shirt with the Twitter logo and a Halloween pumpkin carved with the same logo.
XLM/USDT- 1-Day Trading Chart (Source: CoinMarketCap)
Taking a closer look, XLM is struggling to tap back at its past day’s high of $0.1124. If the 50-day EMA line hits the red candle, turbulence will likely make the price hike or dip.
Since October 10, XLM’s price has declined by over 13%. Although after this downtrend, the coin strived to cross the support zone of $0.1166, it could not break the zone for a good surge. Moreover, the nearest resistance zone for XLM is $0.1139. The price of the coin fluctuated above this zone on October 30 but went down $0.1095 in the past day.
Significantly, XLM has been trading sideways without breaking out from the $0.1315 resistance zone and $0.0992 support zone. This pattern for the coin started in June 2022. If XLM breaks this pattern, it could either soar back to $0.1315 or tumble down below $0.0992.
XLM/USDT- 4-Hour Trading Chart (Source: CoinMarketCap)
The 4-hour chart of XLM also indicates key elements for analysis. There is a downtrend in the 4-hour chart of the coin. As clear from the graph, XLM signaled green before falling off the cliff during the early hours of intraday trading.
Notably, the 50-day EMA line is a critical turning point for XLM as it is currently nearing the red candle.
Disclaimer: The views and opinions as well as all the information shared in this price analysis, are published in good faith. Readers must do their own research and due diligence. Any action taken by the reader is strictly at their own risk. Coin Edition and its affiliates will not be held liable for any direct or indirect damage or loss.
The post XLM Price Plunges, Next Target (NYSE:TGT) Could Be Above $0.1166 Support Zone appeared first on Coin Edition.
