Get 40% Off
👀 👁 🧿 All eyes on Biogen, up +4,56% after posting earnings. Our AI picked it in March 2024.
Which stocks will surge next?
Unlock AI-picked Stocks

YY Inc: Analysis Of The Day

Published 03/09/2018, 04:17 PM
Updated 04/25/2024, 07:23 AM

YY Inc (NASDAQ:YY)


YY Inc. is a social platform that engages users in real-time online group activities through voice, video and text on personal computers and mobile devices. The Company's segments include YY IVAS and others, Huya broadcasting, and 100 Education. YY enables users to create and organize groups of varying sizes to discover and participate in a range of online activities, including music shows, online games, dating shows, live game broadcasting and e-learning. (source: Reuters)
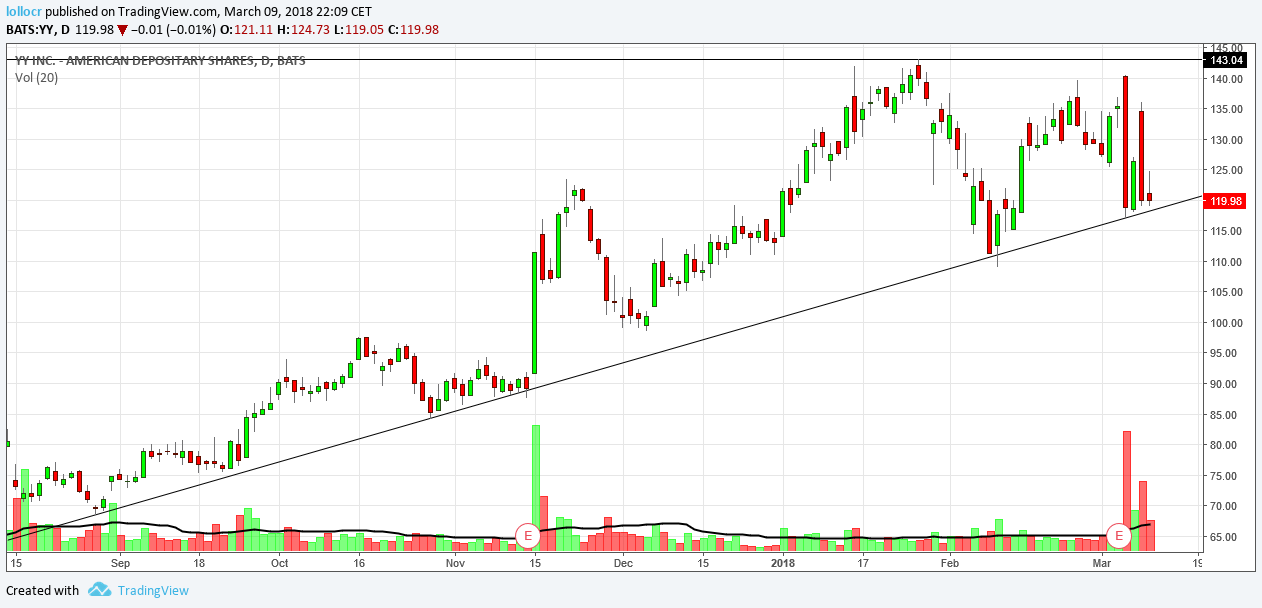
TECHNICAL ANALYSIS:

https://d1-invdn-com.akamaized.net/content/pic6d202ae8119ef8b9c2388e031c360558.
YY Daily Chart


FUNDAMENTAL ANALYSIS:

YY
- The score relative to the fundamental analysis is based on my own algorithm that calculates more than 140 indicators divided into different areas; In this analysis, about 50 of the 140+ indicators will be shown, selected according to the importance and the sector in which the company operates. The analysis refers to the annual (and quarterly) Income statement and Balance sheet of the last 3/5 years.
- The indication "Including: vs. Industry " refers to the comparison between some indicators of the company and the average ones of the industry (for example, the" industry "of Facebook (NASDAQ:FB) is" internet services "and not" Technology "). (the result is already included in the total score of the single area).
- The indication "n" in the “Annual Growth” graph refers to the year of the last annual Income statement and Balance sheet available.
- The indication "n" in the chart "Quarterly - YoY - Growth" refers to the last quarterly Income statement available.
- The "Quarterly - YoY - Growth" chart shows the trend in revenue, operating income and net income in the last quarter, compared to the same quarter 12 months earlier.
- The numbers inside the charts are in millions.
- The term "TTM" in the chart refers to the Trailing Twelve Months (sum of the last 4 quarters available)
- The two moving averages on the price chart are the Exponential moving average 50 and the Exponential moving average 100, while the moving average on the volume chart is the Simple moving average 20.

DISCLAIMER: The information in this blog post represents my own analysis/opinions and does not contain a recommendation for any particular security or investment.

3rd party Ad. Not an offer or recommendation by Investing.com. See disclosure here or remove ads .

Latest comments

Hi Lorenzo, . . Many thanks for your analysis. Do you plan to explain more on the fundamental analysis model you follow?
Risk Disclosure: Trading in financial instruments and/or cryptocurrencies involves high risks including the risk of losing some, or all, of your investment amount, and may not be suitable for all investors. Prices of cryptocurrencies are extremely volatile and may be affected by external factors such as financial, regulatory or political events. Trading on margin increases the financial risks.
Before deciding to trade in financial instrument or cryptocurrencies you should be fully informed of the risks and costs associated with trading the financial markets, carefully consider your investment objectives, level of experience, and risk appetite, and seek professional advice where needed.
Fusion Media would like to remind you that the data contained in this website is not necessarily real-time nor accurate. The data and prices on the website are not necessarily provided by any market or exchange, but may be provided by market makers, and so prices may not be accurate and may differ from the actual price at any given market, meaning prices are indicative and not appropriate for trading purposes. Fusion Media and any provider of the data contained in this website will not accept liability for any loss or damage as a result of your trading, or your reliance on the information contained within this website.
It is prohibited to use, store, reproduce, display, modify, transmit or distribute the data contained in this website without the explicit prior written permission of Fusion Media and/or the data provider. All intellectual property rights are reserved by the providers and/or the exchange providing the data contained in this website.
Fusion Media may be compensated by the advertisers that appear on the website, based on your interaction with the advertisements or advertisers.
© 2007-2024 - Fusion Media Limited. All Rights Reserved.