With the stock market collapsing 6% from its all-time high in just two weeks, a lot of people are freaking out.
Don’t follow them!
Because now is the best time to buy we’ve seen in a long time.
Before I show you my top 3 “buy now” indicators—which are all blaring green—and a bargain 7.5%-yielder to jump on now, let me first say that we’ve been here before.
In mid-February, with the market again on its back, I urged readers not to panic. This has happened since:
A Quick Recovery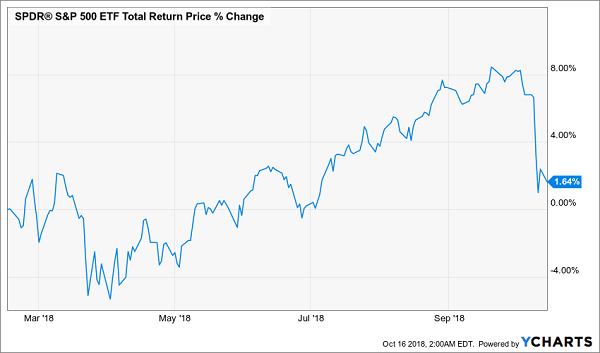
While a 1.6% total return in 8 months isn’t much to write home about, it’s not the massive loss a lot of investors are terrified of today. Plus, an 8-month period is so short to be almost meaningless. Check out how investors who bought during the big correction in early 2016 have done:
You Can Choose Contrarian Outperformance …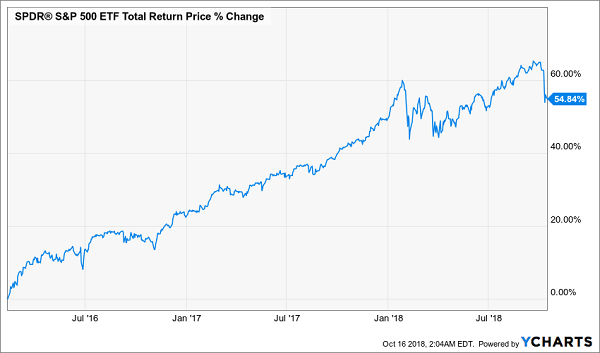
But if you’d waited until the market started recovering fully in April 2016, you’d have a far smaller return:
… Or Diminished Profits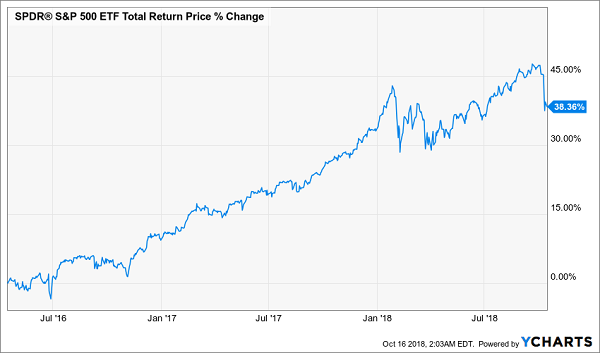
We are now in a similar position with stocks. But given the wild swings we’ve seen in the last few weeks, I understand if you’re still skeptical. That’s why I’ve written up the 3 rock-solid “buy now” indicators I’ll show you next.
Buy Indicator No. 1: Third Quarter Profits Are Soaring
In both the first and second quarters of this year, S&P 500 firms reported earnings that demolished expectations and delivered record growth.
That trend isn’t stopping.
While it’s early for third-quarter reports, so far the news is good. Net profit margins across the S&P 500 are 11.6%, which is where they were in the first quarter. That’s far ahead of what we’ve seen in the last 5 years:
Q3 Brings “Levitating” Profits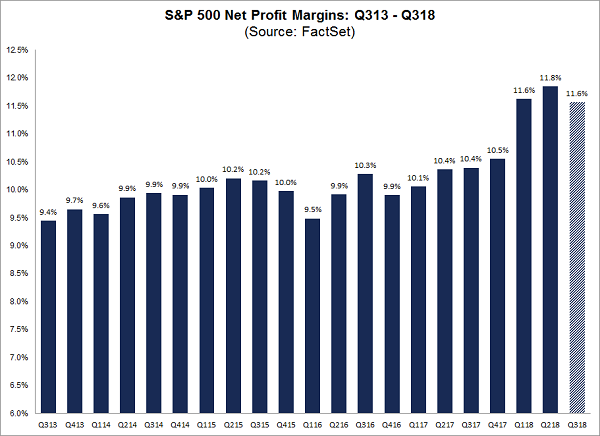
When all is said and done, analysts expect 19.2% earnings growth on a year-over-year basis for the third quarter, which is miles ahead of the 3.5% annualized growth in the last decade. It also means stocks are the cheapest in years—the S&P 500’s forward P/E ratio is at 15.7, way below its historical average:
Stocks Getting Cheap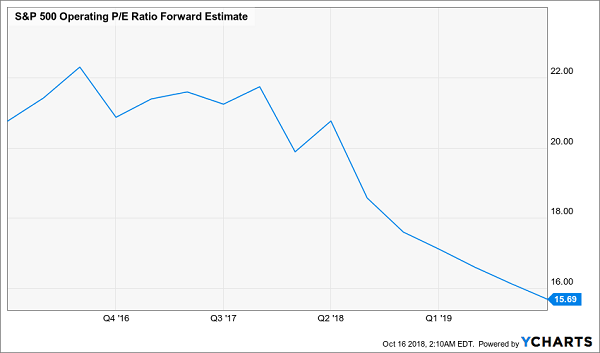
With higher earnings and lower stock prices, this is a rare buying opportunity.
Buy Indicator No. 2: Fatter Paychecks, Higher Spending
The good news isn’t just limited to companies—that would be a bad thing! Average Americans are doing better, too.
Since March of this year, average weekly earnings have risen more than 3%, the fastest growth since 2010. The trend has lasted longer this time than back then, when we saw wages rise above 3% for just 2 months in a 5-month period.
Salaries Swell, Retailers Rejoice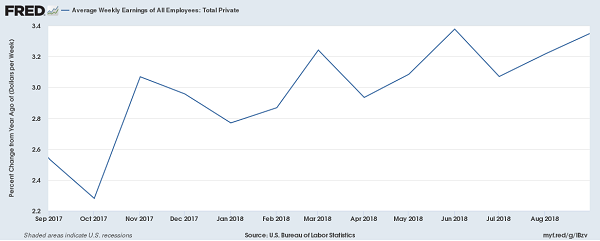
Note that the line is both staying above 3% and is in an uptrend. That rise has broken a resistance level wages saw throughout 2014 and most of 2017:
Wage Gains Break Out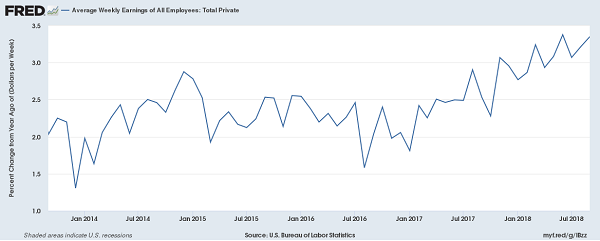
The wage news is incredibly good and keeps getting better. When Americans have more money in their pockets, they go shopping. That’s helped corporate revenue: all told, S&P 500 companies’ sales are up nearly 5%, the highest year-over-year growth in nearly a decade.
Buy Indicator No. 3: Hitting “Snooze” on the Recession Alarm
The final good piece of news is something I covered in-depth in my October 15 article.
Earlier in 2018, many financial analysts and journalists fretted that the flattening trend in the yield curve (or the spread between the yields on the 2-year and 10-year Treasury notes) would usher in a recession in the next year or so. This was reasonable: an inverted yield curve has preceded every modern recession on record.
But the trend toward a flatter yield curve suddenly stopped in September:
A Dangerous Sign Fades Away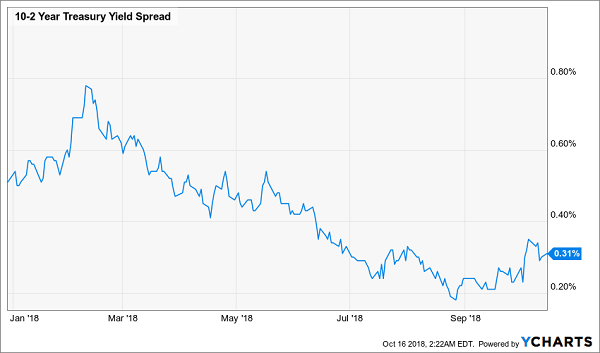
This remains one of the greatest indicators of financial health in the United States, so we need to keep a close eye on it. But for now, the odds of a 2019 recession are vanishing.
1 Fund (Paying 7.5% in Cash) to Buy Now
If the economy is booming and earnings are still rising, now may be the worst time to sell—especially since everyone else is. So you could buy the S&P 500 ETF (SPY (NYSE:SPY)) and get a strong return over the next few months.
But you could get a stronger return with a fund like the John Hancock Tax Advantaged Dividend Income Closed Fund (NYSE:HTD).
Why? For one, HTD has crushed the S&P 500, despite its focus on large-cap value companies:
Dusting the Benchmark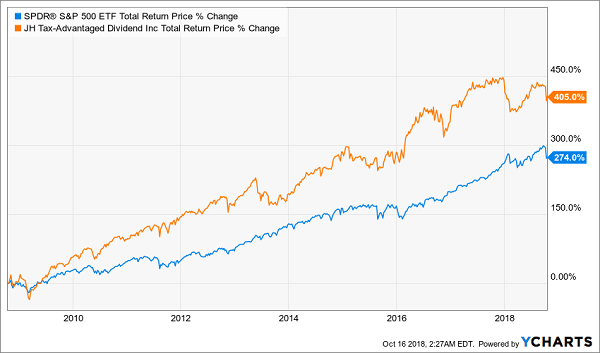
With a 405% total return in the last decade versus 274% for the S&P 500 index fund, HTD has a proven track record. And it notches gains like that while delivering a 7.5% dividend, giving us a serious income stream we can use however we like.
The market hasn’t rewarded HTD, however; despite its solid track record, the fund trades at a 7.9% discount to net asset value (NAV, or what it’s underlying portfolio is worth), far lower than where it traded in late 2017:
HTD Goes on Sale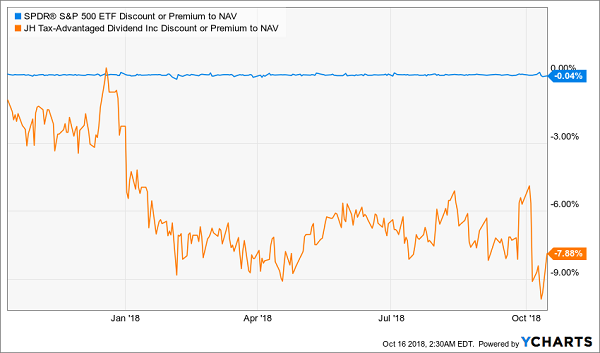
When the market recovers, I expect HTD’s NAV to rise, helping it deliver capital gains.
But I also think other investors will realize HTD’s solid performance when its NAV rises, causing more bidding pressure to result in a smaller discount, compounding HTD’s return. Investors who buy now can enjoy the fund’s 7.5% dividend while they wait for that to happen.
Your Best Selloff Buy Now: 8.4% Dividends and Big 2019 Gains
Here’s something else I need to tell you: the selloff knocked one of my top 4 CEF buys to an amazing 14% discount to NAV!
In plain English, that means we’re getting this standout fund’s portfolio—top-notch high yielders like Ventas Inc (NYSE:VTR) and Enbridge Inc (NYSE:ENB)—for just 86 cents on the dollar!
This bargain fund then takes these stocks’ massive dividends (plus the upside its veteran managers squeeze from its rock-solid portfolio) and hands them to you in the form of a huge 8.4% dividend paid monthly!
Your Monthly “Paychecks” Await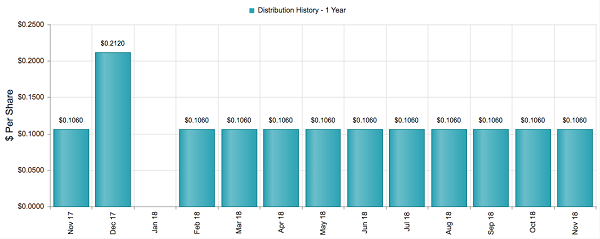
This is the perfect investment for today’s churned-up markets. Because thanks to this fund’s huge discount, my team and I have it pegged for easy 20% price upside in 2019.
And that’s on top of its incredible 8.4% CASH dividend!
Plus, you get some invaluable downside protection, because even if we get hit with an unexpected market collapse, we’re still covered: thanks to this fund’s big markdown, it will just trade flat—and we’ll still pocket its massive 8.4% payout!
This is the ultimate “sleep well at night” buy, and I can’t wait to show it to you. Click here and I’ll give you full details—name, buy-under price, ticker and more—on this fund and 3 other ridiculously cheap high yielders that must be on your buy list now. Don’t miss out!
Disclosure: Brett Owens and Michael Foster are contrarian income investors who look for undervalued stocks/funds across the U.S. markets. Click here to learn how to profit from their strategies in the latest report, "7 Great Dividend Growth Stocks for a Secure Retirement."
