Get 40% Off
🚨 Volatile Markets? Find Hidden Gems for Serious Outperformance
Find Stocks Now

Yen In Risk-Off Mode; Stocks Near All-Time Highs. What's Next?

Published 12/08/2019, 12:19 AM
Updated 07/09/2023, 06:31 AM

Nonfarm Payroll data was released Friday morning and the headline number was better than expected. As a result, U.S. stock markets were up at or near 1% on the day, closing in once again on all-time highs.
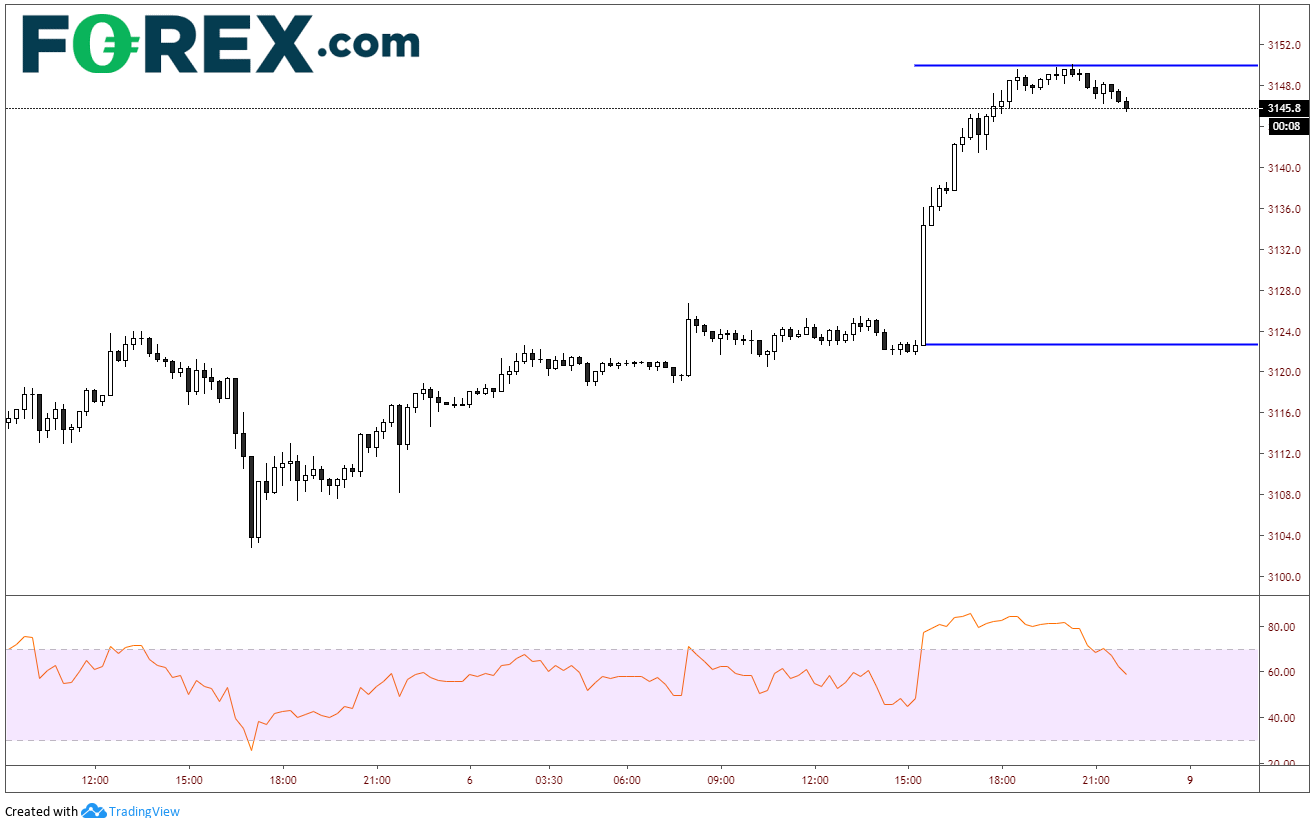
SPX Chart

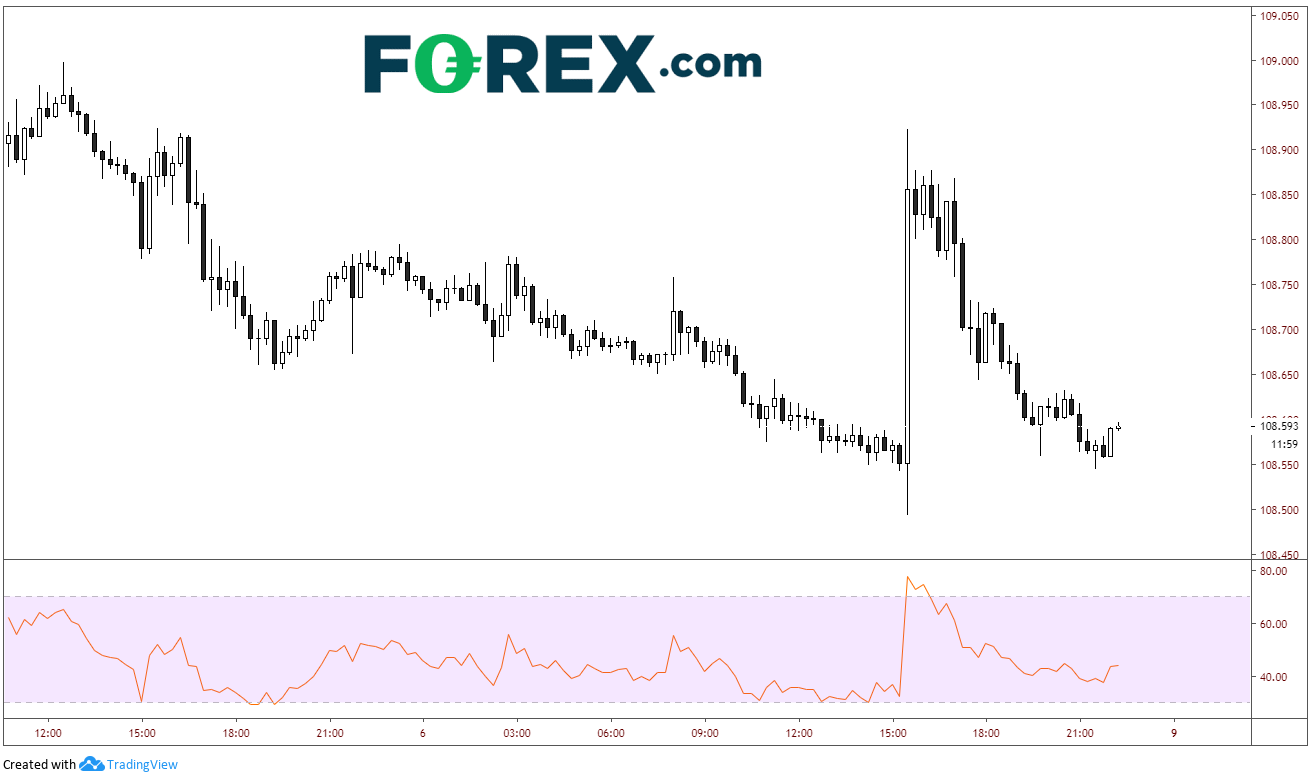
As one would expect, with a strong move higher in stocks, USD/JPY would follow. But take a look at the price action in USD/JPY since the initial move after the NFP data was released:
USD/JPY Chart

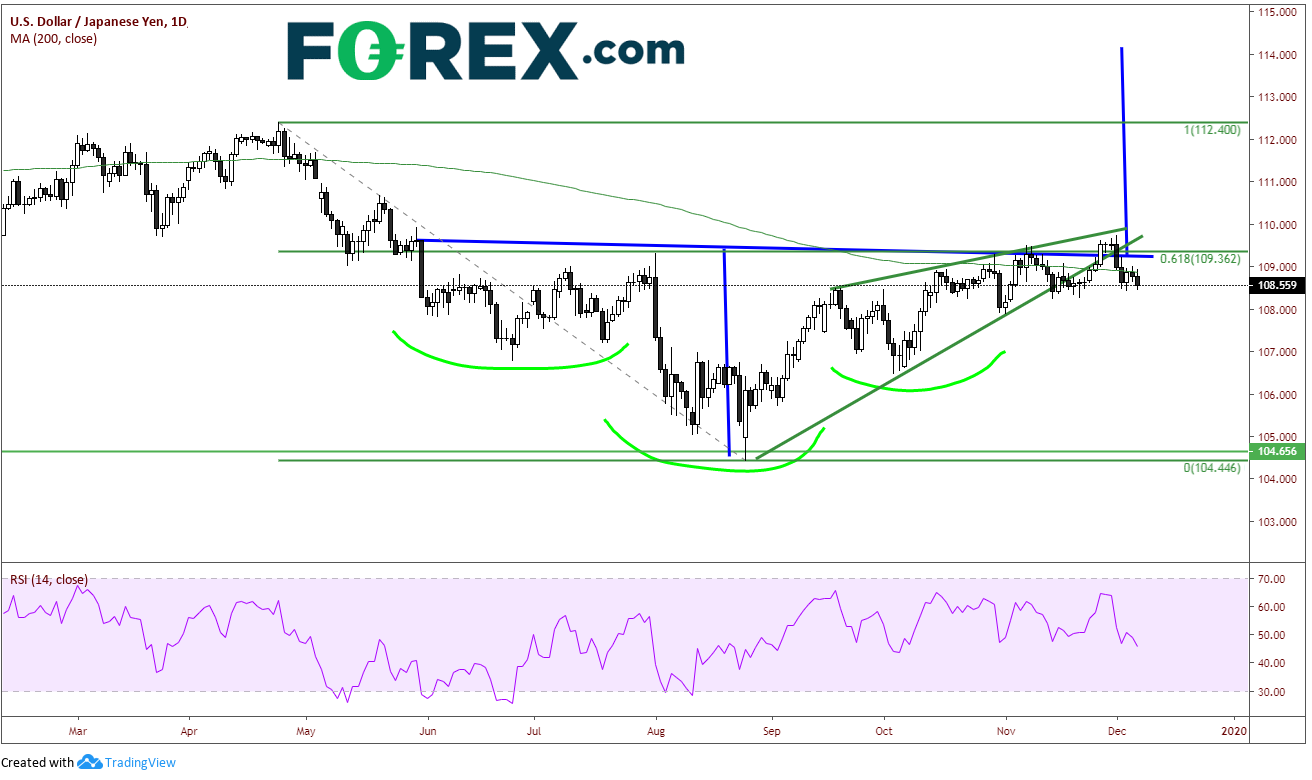
USD/JPY was actually down slightly on the day! On a daily timeframe, the pair couldn’t close about the 109.50 level, and therefore failed to break above the neckline of the inverted head and shoulders pattern. In addition, that level represented the 61.8% Fibonacci retracement level from the highs of April 24th to the lows on August 26th. Also, a rising wedge was formed, and price broke lower out of the wedge. (The target for a break from a rising wedge is 100% of the wedge, which would be near the 104.50 level.) USD/JPY closed back below 109.00 on Monday, and then below the 200 Day moving average on Tuesday. The pair hasn’t been able to close above it since Friday of last week.
USD/JPY Daily Chart

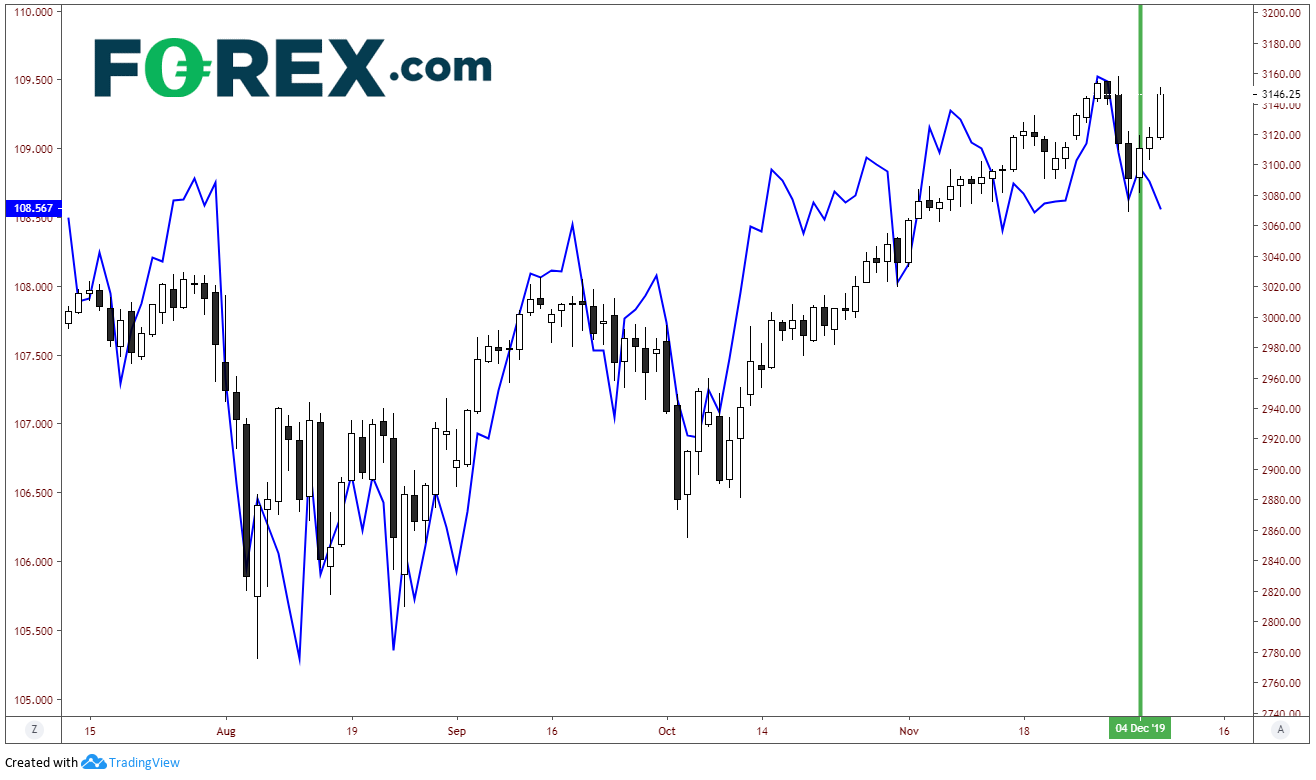
Traditionally, stocks and USD/JPY move together. However, take a look at how the 2 assets have diverged over the last two days.
SPX vs USD/JPY Daily Chart

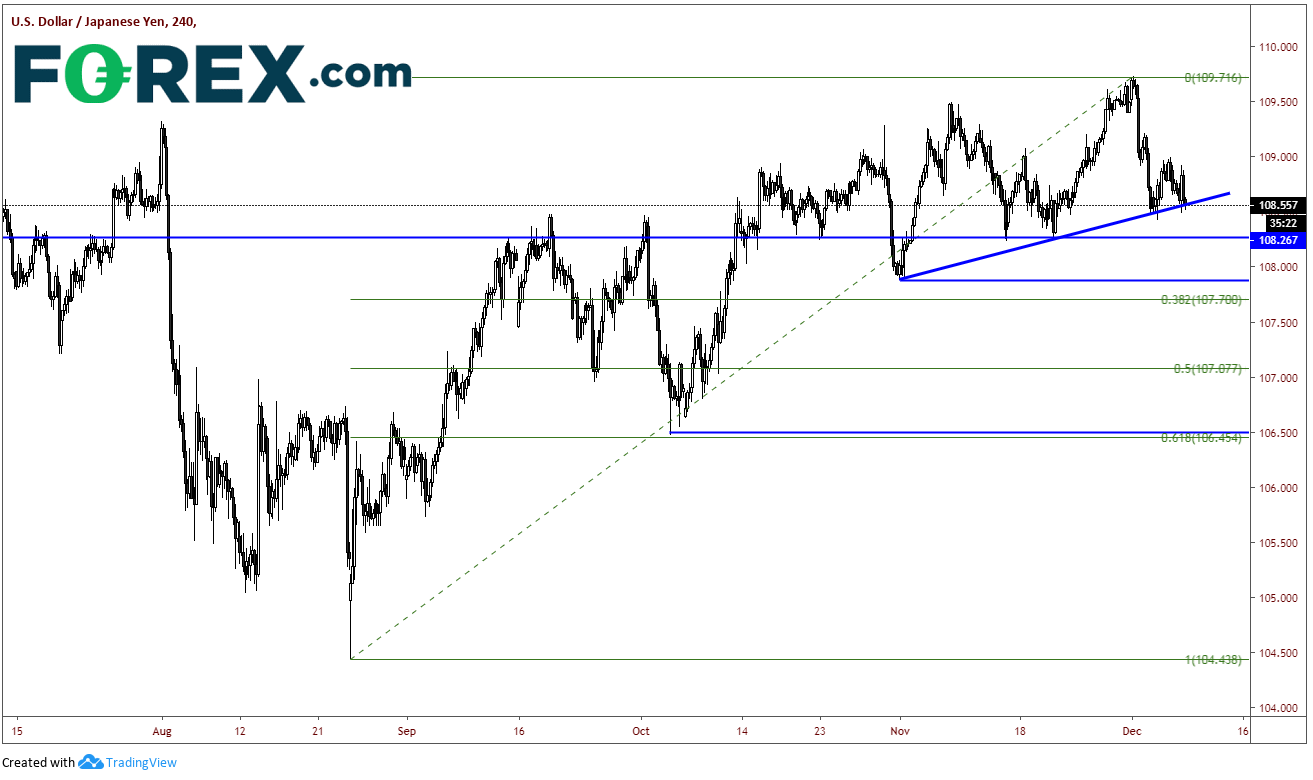
First support now comes in at Wednesday’s lows and the 38.2% Fibonacci retracement level from the lows on October 3rd to the highs on December 2nd near 108.40/50. Below there is horizonal support near 108.25. But the ultimate support doesn’t come across until 104.50, which is the low from August 23rd, however there are various horizontal support levels all the way down to that level.
3rd party Ad. Not an offer or recommendation by Investing.com. See disclosure here or remove ads .
USD/JPY 240 Min Chart

That leads us to beg the question….What happens to USD/JPY if stocks begin to sell off next week? More specifically, what happens to USD/JPY (and other JPY pairs) if there is a hawkish statement from the FOMC on Wednesday? Or what happens to the pair if Boris Johnson loses the election on Thursday? Or what happens if a U.S.-China trade deal is off the table? The risk is that stocks will move lower. And if that is the case, USD/JPY may be ready for a move even lower with them.

Original Post

Latest comments

Risk Disclosure: Trading in financial instruments and/or cryptocurrencies involves high risks including the risk of losing some, or all, of your investment amount, and may not be suitable for all investors. Prices of cryptocurrencies are extremely volatile and may be affected by external factors such as financial, regulatory or political events. Trading on margin increases the financial risks.
Before deciding to trade in financial instrument or cryptocurrencies you should be fully informed of the risks and costs associated with trading the financial markets, carefully consider your investment objectives, level of experience, and risk appetite, and seek professional advice where needed.
Fusion Media would like to remind you that the data contained in this website is not necessarily real-time nor accurate. The data and prices on the website are not necessarily provided by any market or exchange, but may be provided by market makers, and so prices may not be accurate and may differ from the actual price at any given market, meaning prices are indicative and not appropriate for trading purposes. Fusion Media and any provider of the data contained in this website will not accept liability for any loss or damage as a result of your trading, or your reliance on the information contained within this website.
It is prohibited to use, store, reproduce, display, modify, transmit or distribute the data contained in this website without the explicit prior written permission of Fusion Media and/or the data provider. All intellectual property rights are reserved by the providers and/or the exchange providing the data contained in this website.
Fusion Media may be compensated by the advertisers that appear on the website, based on your interaction with the advertisements or advertisers.
© 2007-2024 - Fusion Media Limited. All Rights Reserved.