
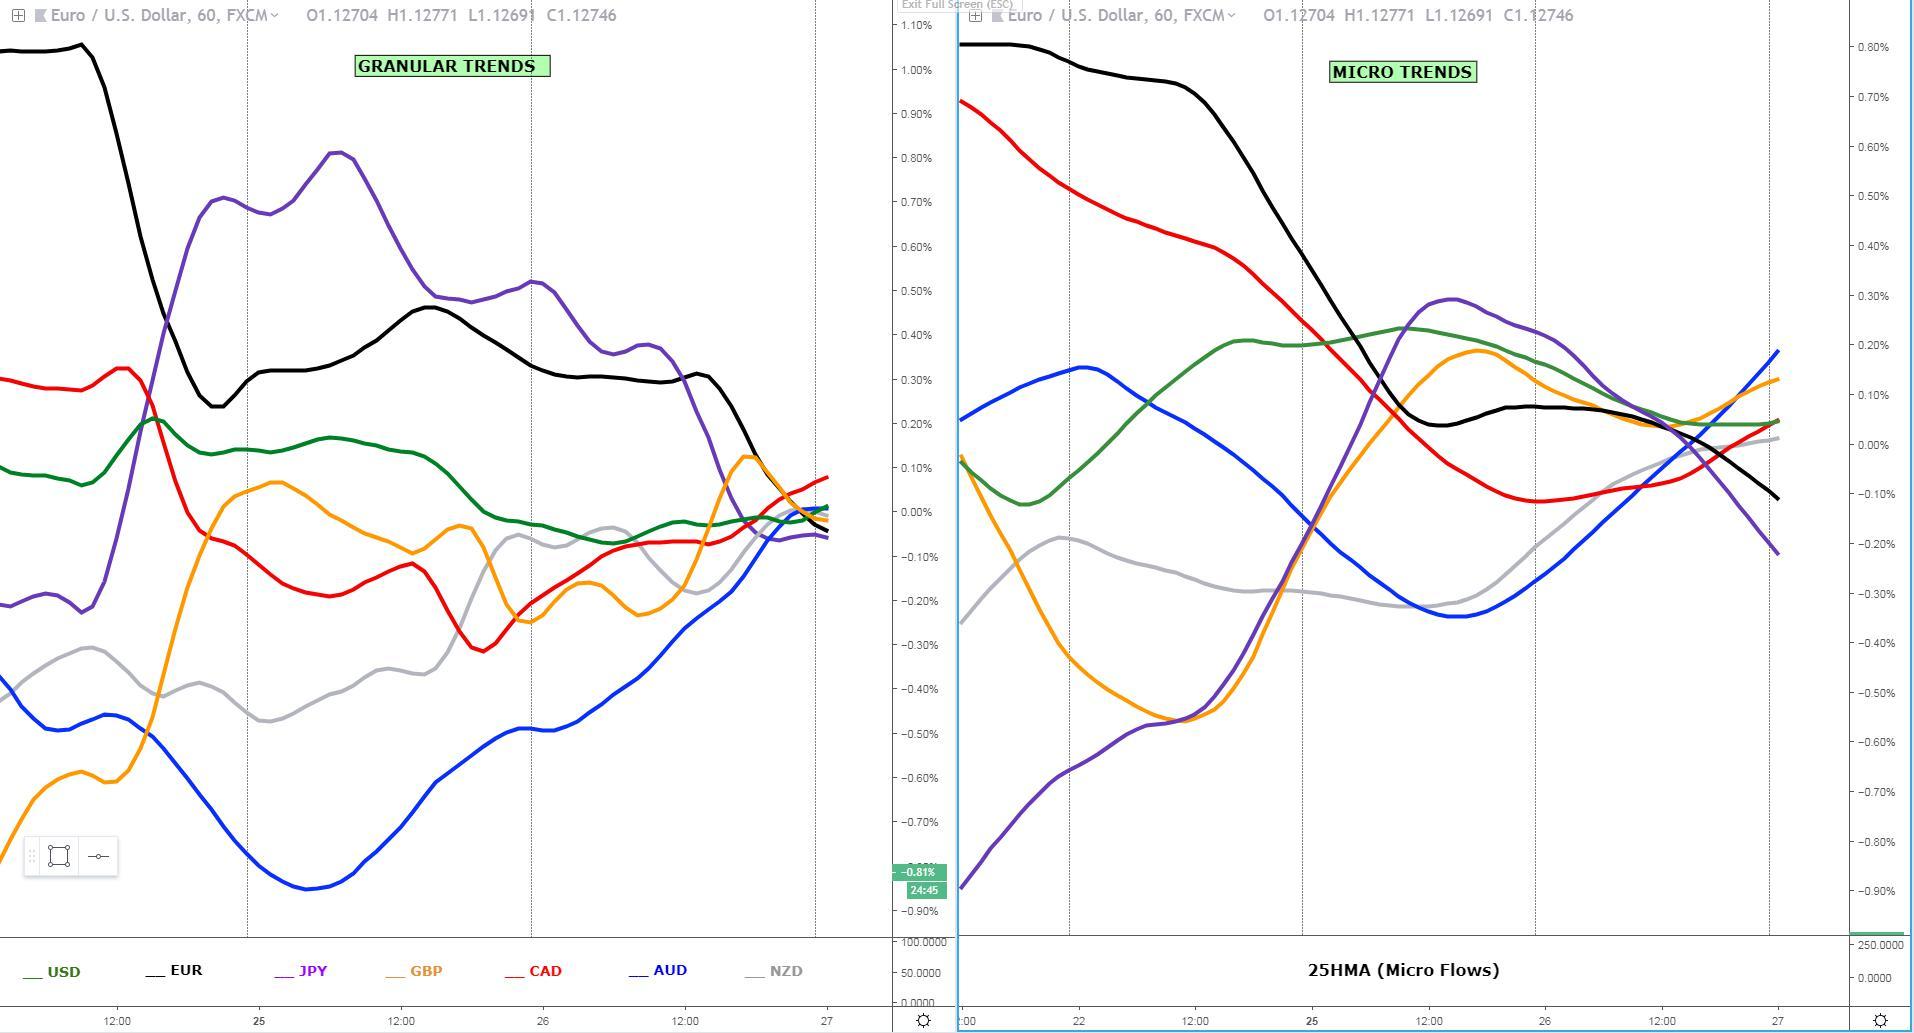
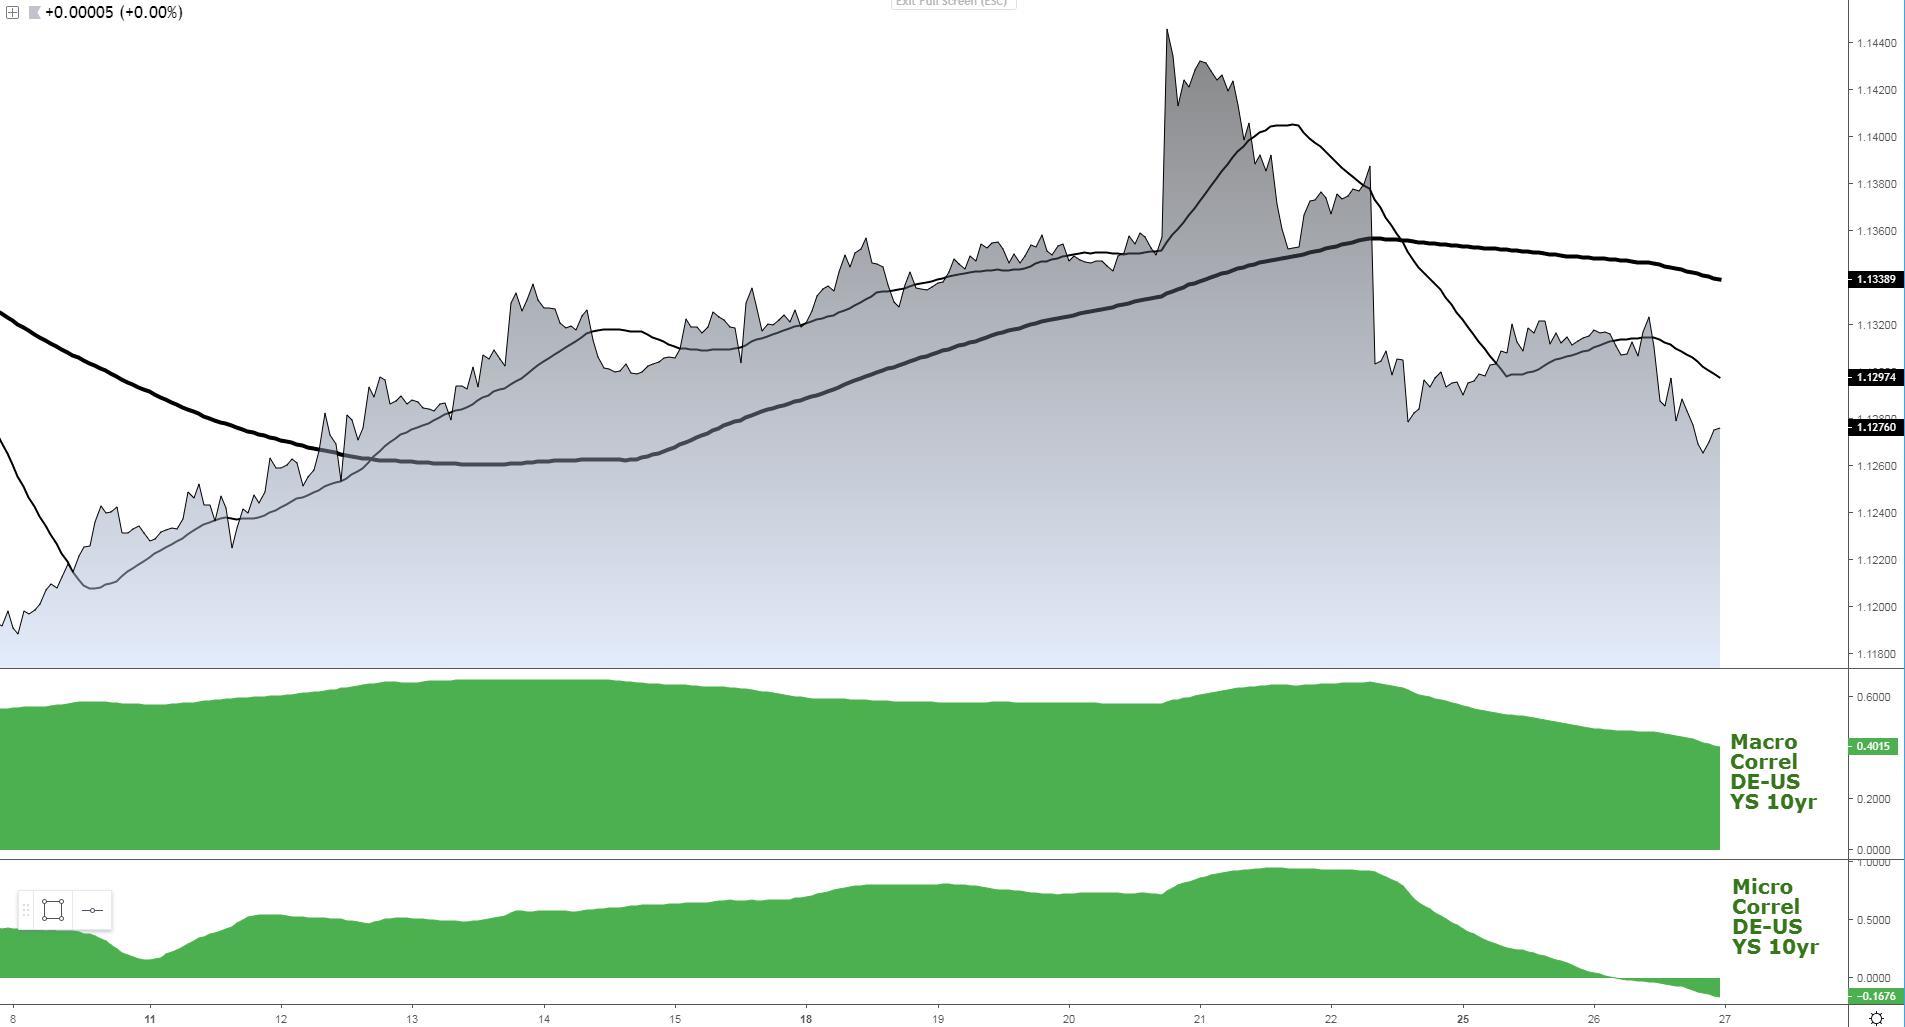
The compression of the micro slopes back to the mean portrays a currency market with a deficit of committed capital to support macro trends. The euro could be the exception. Instead, the recent strength in the likes of the yen has abated while other currencies such as the sterling have failed to shift into higher gears even if sufficient pockets of demand have been maintained to keep it elevated by G10 FX standards. The Aussie has been the main beneficiary of the recovery in equities, even if it’s found a wave of selling pressure during the ongoing Asian session in response to the sharp selloff in the Kiwi, as the RBNZ joins the rest of G10 Central Banks in explicitly shifting its forward guidance to lower rates. We shouldn’t forget about the euro, which alongside the yen, has seen the most supply imbalances, in what still appears to be the lingering effects of a fundamentally-adjusted deterioration in its value on the basis of mounting fears that Germany is set to go through a prolonged recessionary period.
Key Narratives in Financial Markets
- US data disappoints (consumer confidence and housing starts). The former dropped to 124.1 from 131.4, while the latter saw a sharp retracement of -8.7%. The raft of US economic data (as seen below in the calendar) was largely ignored as a driver for markets.
- The ERG group hints to support May’s Brexit deal, while the DUP is not backing from its hard-line stance. Remember, UK PM May is no longer in full control of the Brexit process, which has led to the announcement of a series of indicative votes on alternatives out of the Brexit mess. UK PM May is still determined to table her deal on Thursday (uncertain if she will), but without the support of the DUP party, the chances of the bill passing are virtually null. The conundrum continues.
- The RBNZ shifts the narrative. Expectations are that the next rate move will be to lower the rate. This would drive the NZD lower as well. Essentially, what RBNZ does here is to join the bandwagon of easing biases, which is now the norm across all key Central Banks with the exception of the BoE.
Recent Economic Indicators And Events Ahead
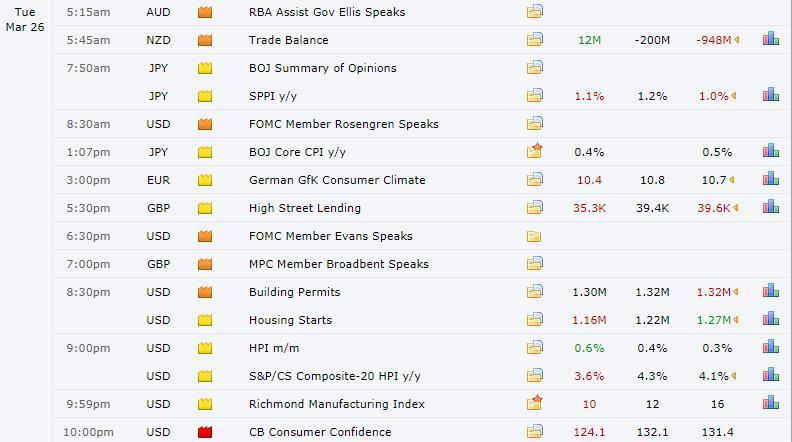
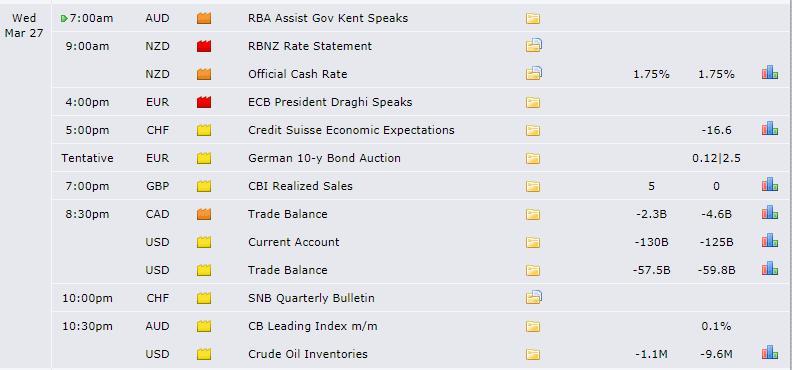
Source: Forexfactory
RORO - Risk On Risk Off Conditions
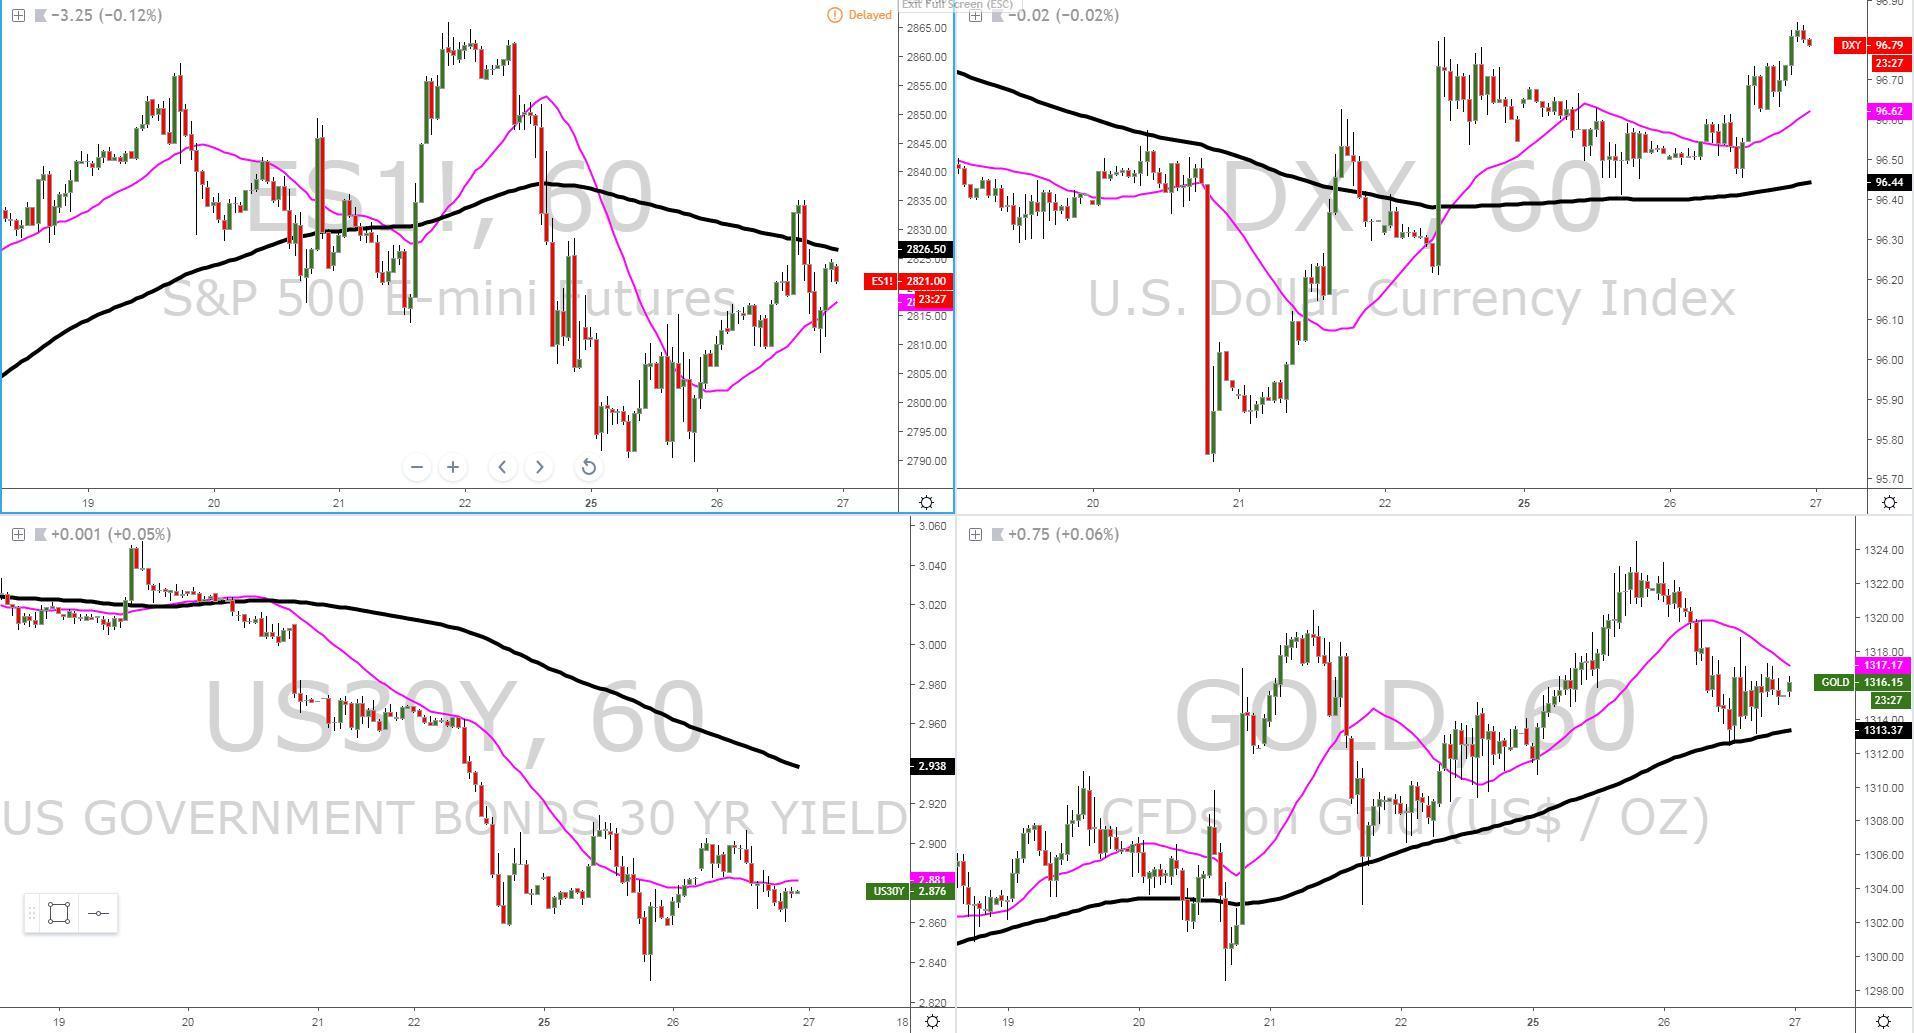
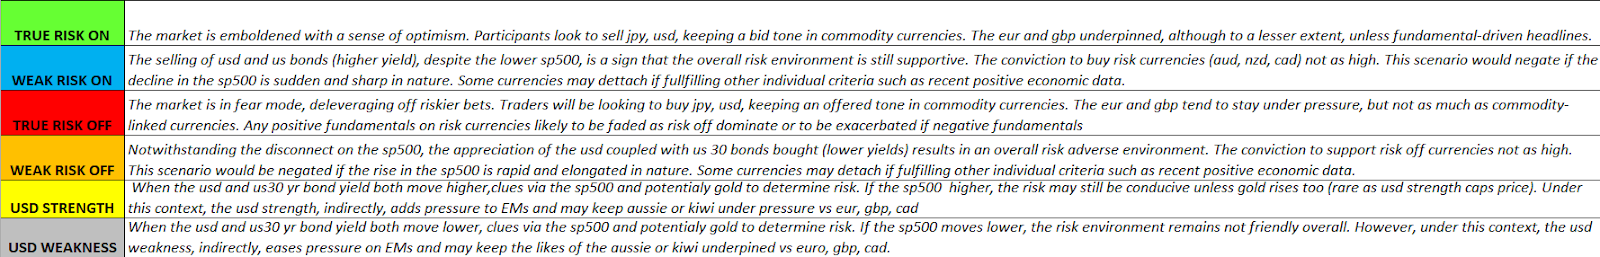
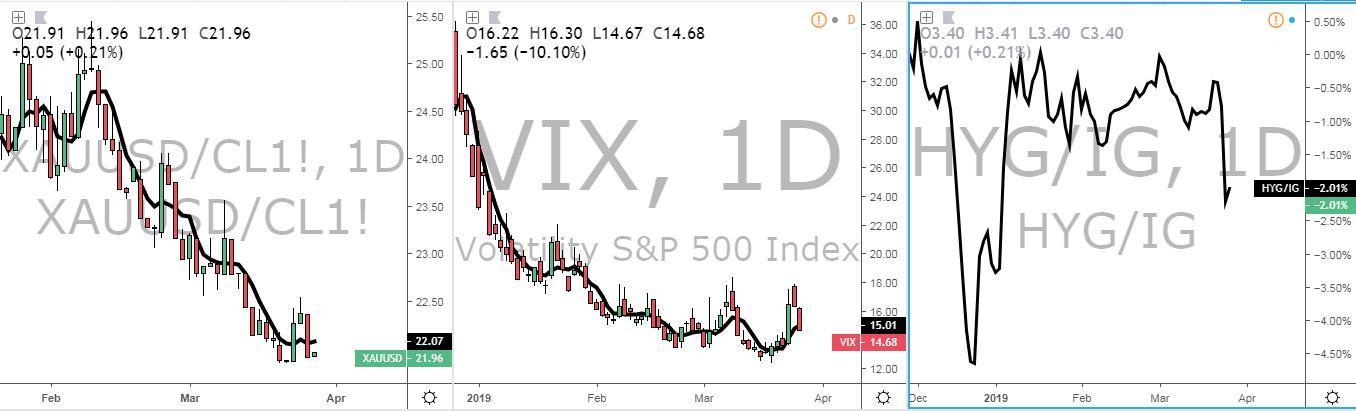
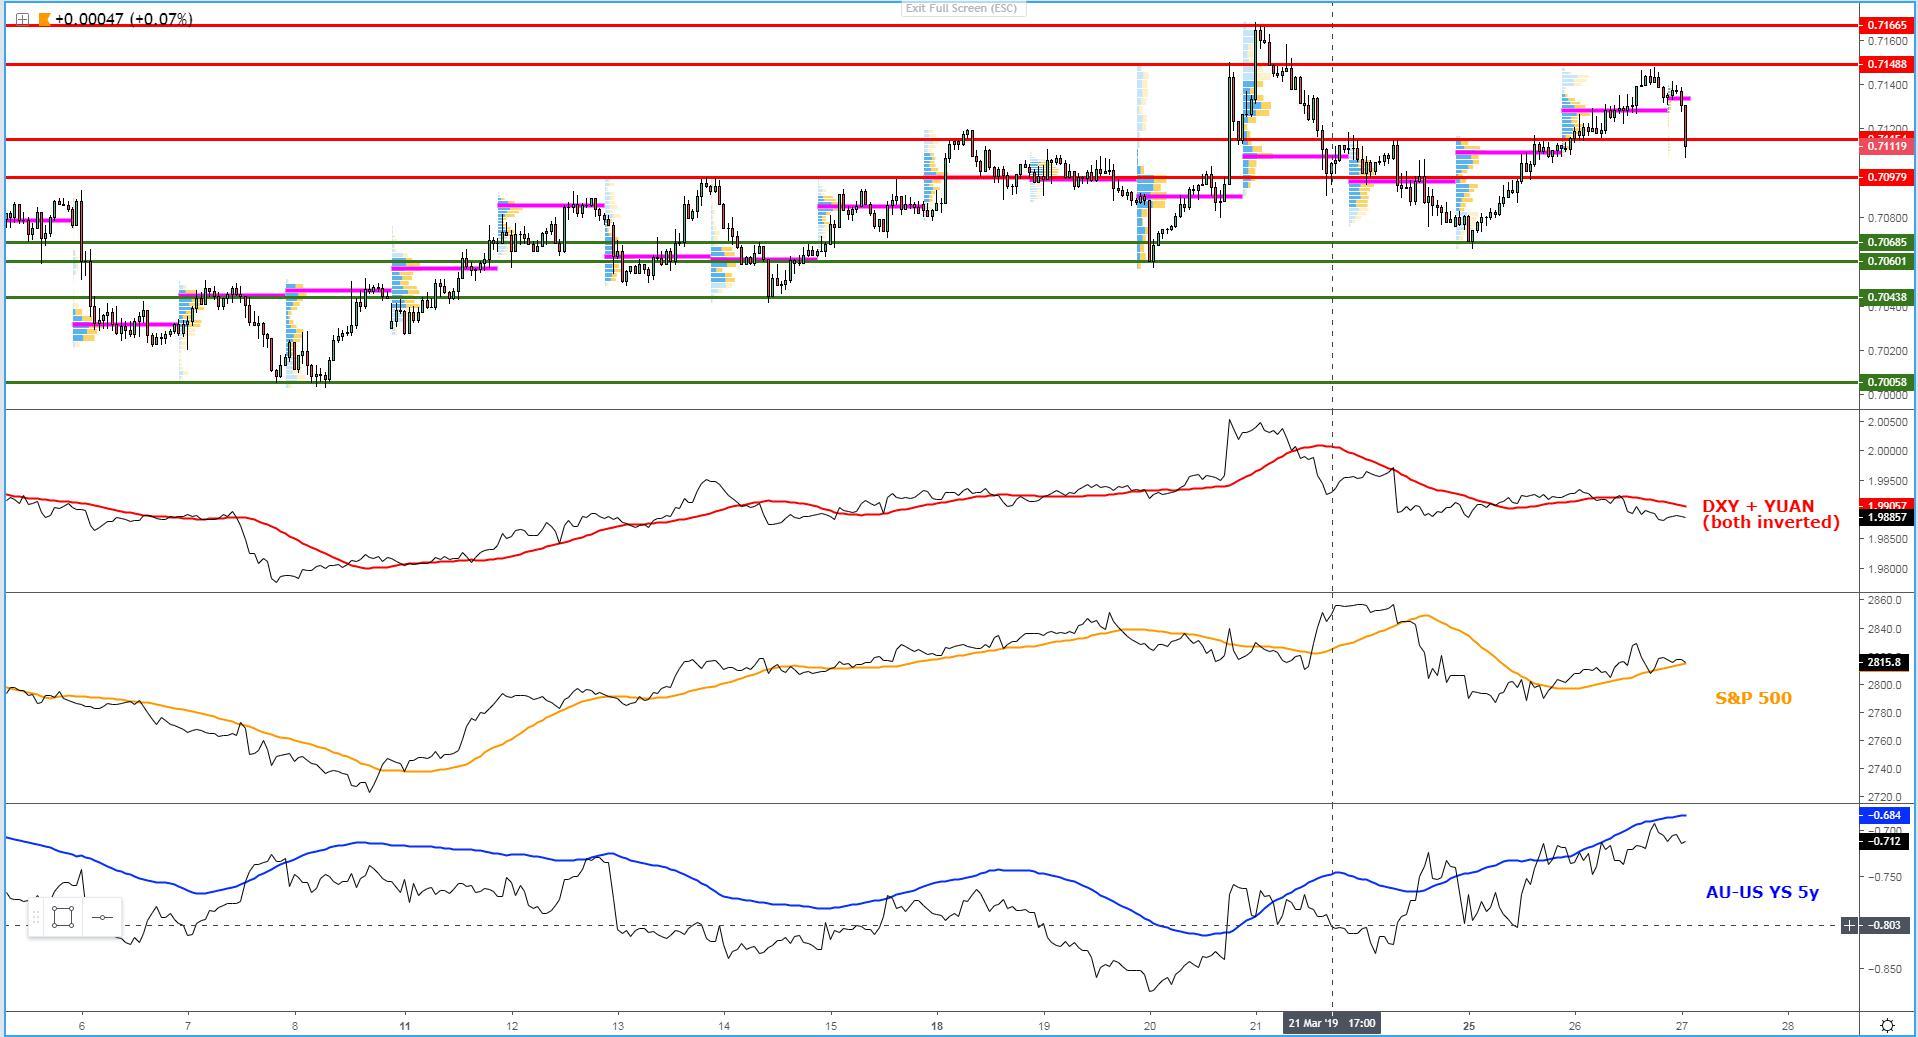
The latest boost in risk assets appears to have more to do with a short squeeze than a genuine rally with sufficient substance as the pre-conditions of our RORO model are not met. The micro slopes, which essentially translates in the dominating flows from the last 24 hour, portray an environment where the rise in US equities (S&P 500 as the barometer) fails to be supported by depressed global yields (US 30y as the reference here), at a time when the US Dollar index is recovering its allure further. This is an environment that our model defines as ‘weak risk off’, even if we need to be cautious as the latest push up in the DXY appears to have been, for the most part, due to EUR weakness rather than domination of the US dollar flows across the board. That said, the terrain is still quite muddy to get too excited in a risk recovery extension, as from a technical perspective, the S&P 500 still exhibits what up until now still represent the valid assumption of a new initiated sell-side campaign as depicted by the successful rotation of lower lows off March 22nd high. If we then account for the depressed state of US yields, while the DXY shows signs of life, we are not in an environment to be too complacent as the shadow of risk-off in financial markets still lurks on the background. By checking alternative measures to take the pulse of risk, we can observe the ratio of Oil vs Gold hovering around trend lows, which is a positive signal, while the VIX (vol index) has also managed to come back down from the highs 18.00 towards the 15.00 vicinity. However, if we look at credit markets, the fact that high-yielding corp debt ETFs aka junk bonds (HYG) have been overwhelmingly underperforming investment grade ETFs (IG) throughout March is a reason for concern as this ratio tends to be strongly correlated with stocks yet it shows a noticeable divergence at this stage.
Summary: Intermarket Flows And Technical Analysis
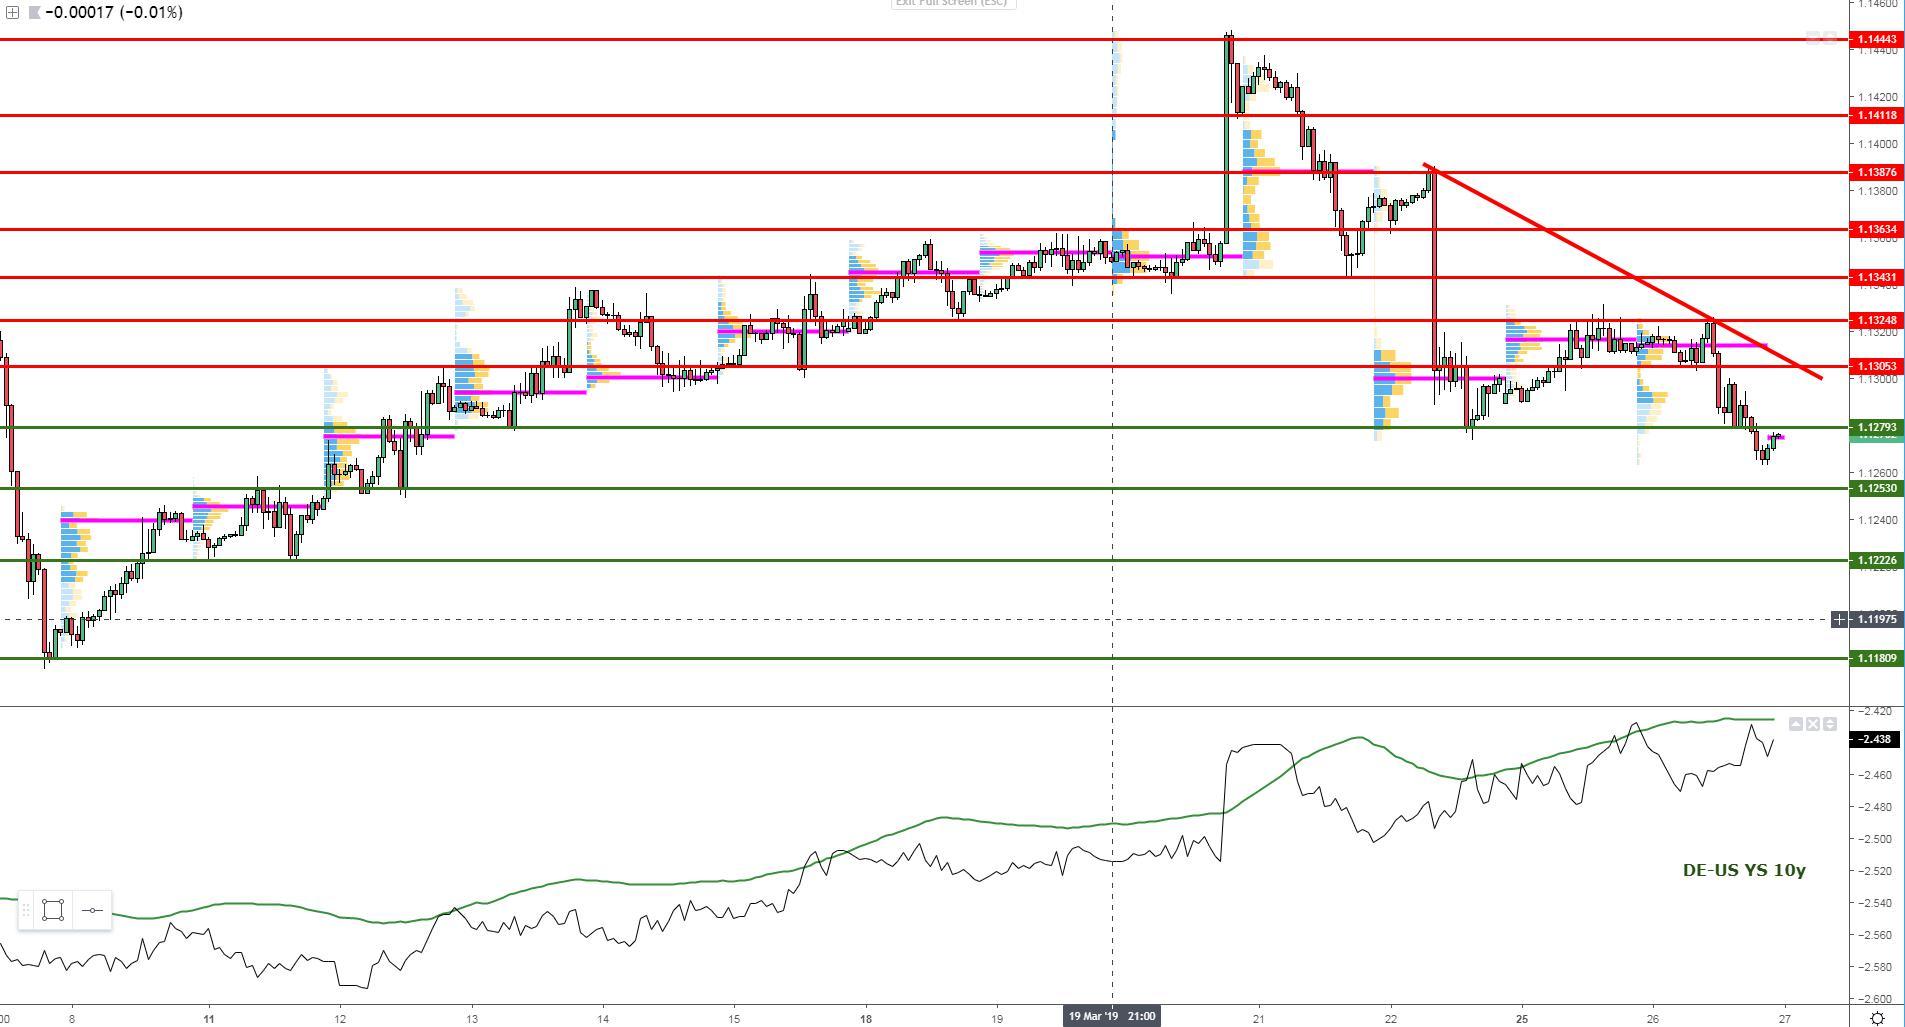
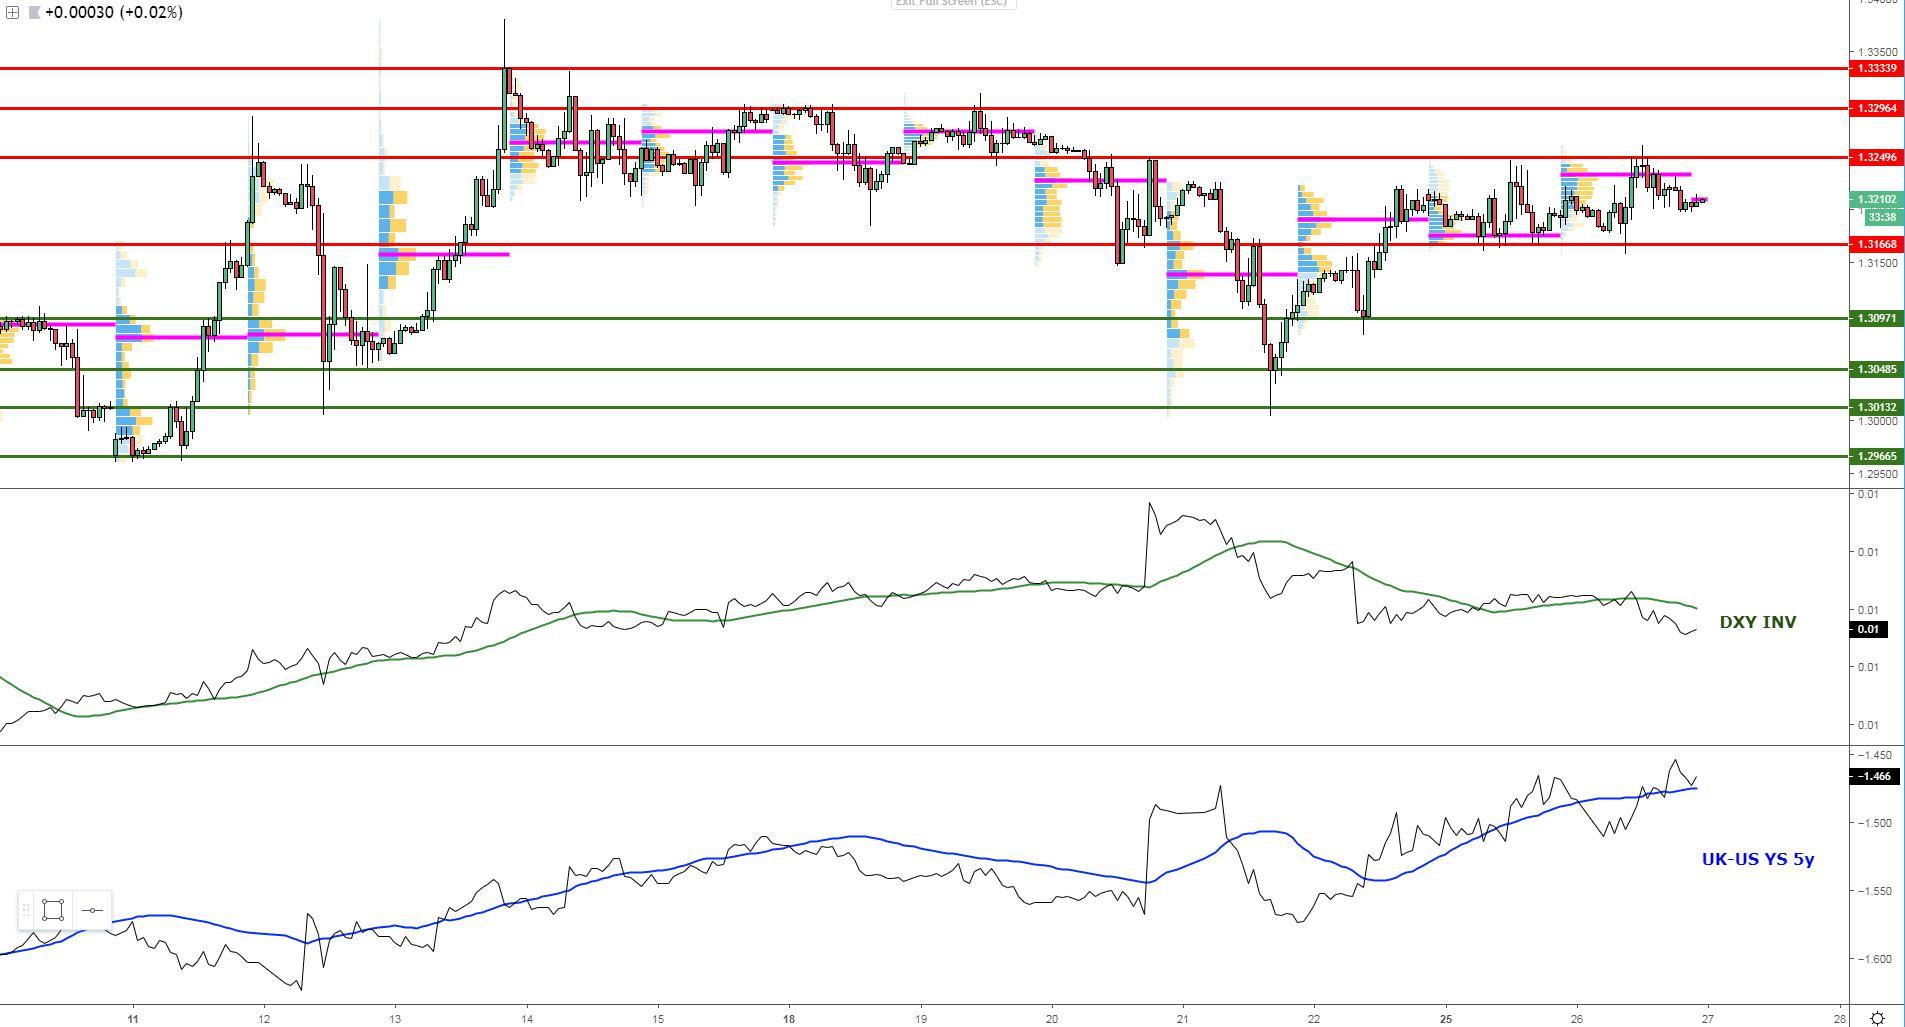
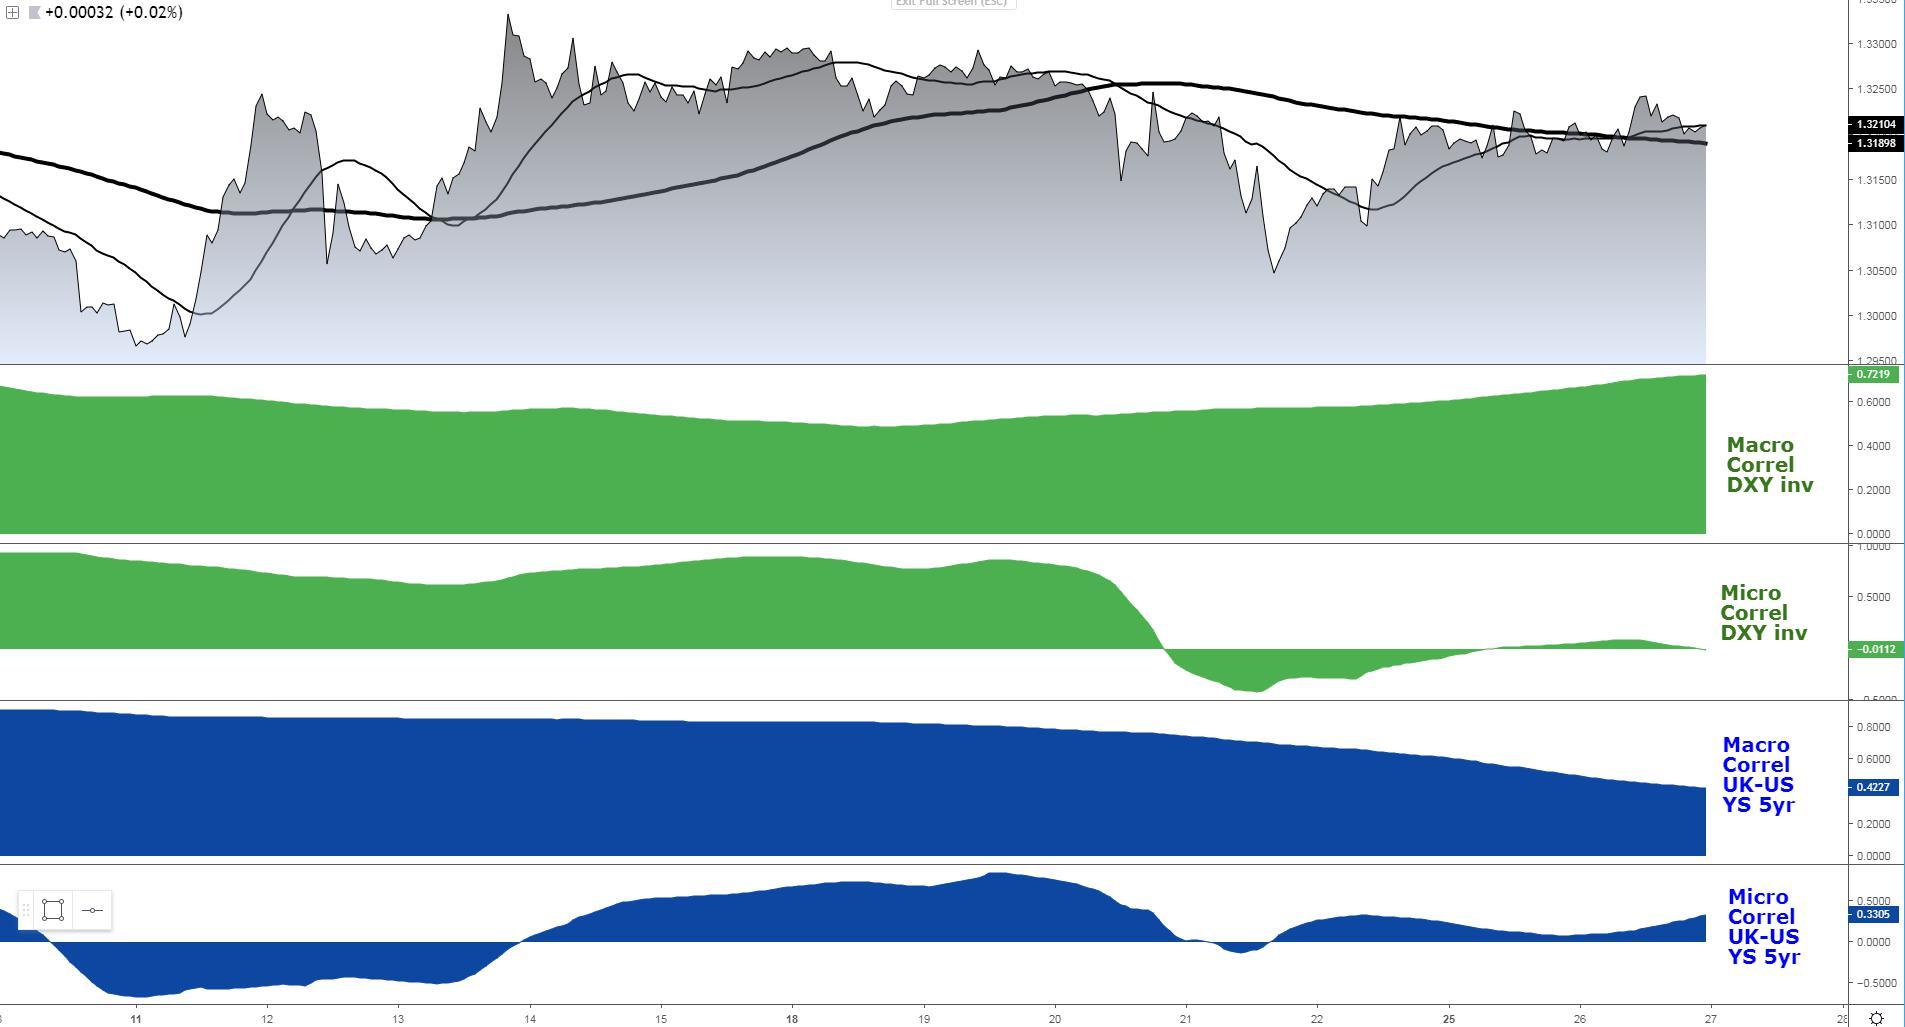
EUR/USD: Building Lower Lows Despite Not Yield Backing
A resolution of the 20p price jam, what I usually refer to as a balance area, has finally transpired. Sellers came in with conviction to create an impulsive breakout which has resulted in a new bearish cycle low. The fall in the exchange rate allows us to draw a new descending trendline, while it proves that we are at a stage where the market seems more concerned on adjusting the EUR valuation lower on the back of recessionary fears in Germany than taking as guidance the uptrending 10 year German vs US bond yields spread, as the negative micro correlation clearly demonstrates. At the bare minimum, the disadvantageous position by the USD when it comes to capital flows should make it harder for the exchange rate to go through episodes of sustainable selloffs as the lower value is not justified. Still, make the technical your number 1 guidance here until evidence of yield spreads playing a greater role again. The double distribution down in the volume profile communicates any rebound represents potential sell side opportunities given the concentrated volume above 1.13 caught wrong-sided.
GBP/USD: Relatively Calm Water Ahead of The ‘Indicative Votes’
It is only fair not to bore you to death over analyzing an exchange rate that remains in a clear stagnation phase, with the range well defined between 1.3165 and 1.3250, an area where bids/offers have concentrated while we await some type of clarity in the Brexit front. The prolonged range this week is, to a certain extent, a communication that the whole Brexit mess has got the market tired of continuously second-guessing the repercussions of a political landscape that remains highly fluid. Wednesday’s “indicative votes” in the UK parliament should act as a driver to see a renewed injection of vol and hopefully the range broken. If any attempt to breakout the balance area were to occur ahead of the votes, it’d have to be a headline that by itself has enough merit to move the GBP, otherwise, the risk of rotational moves should be eyed.
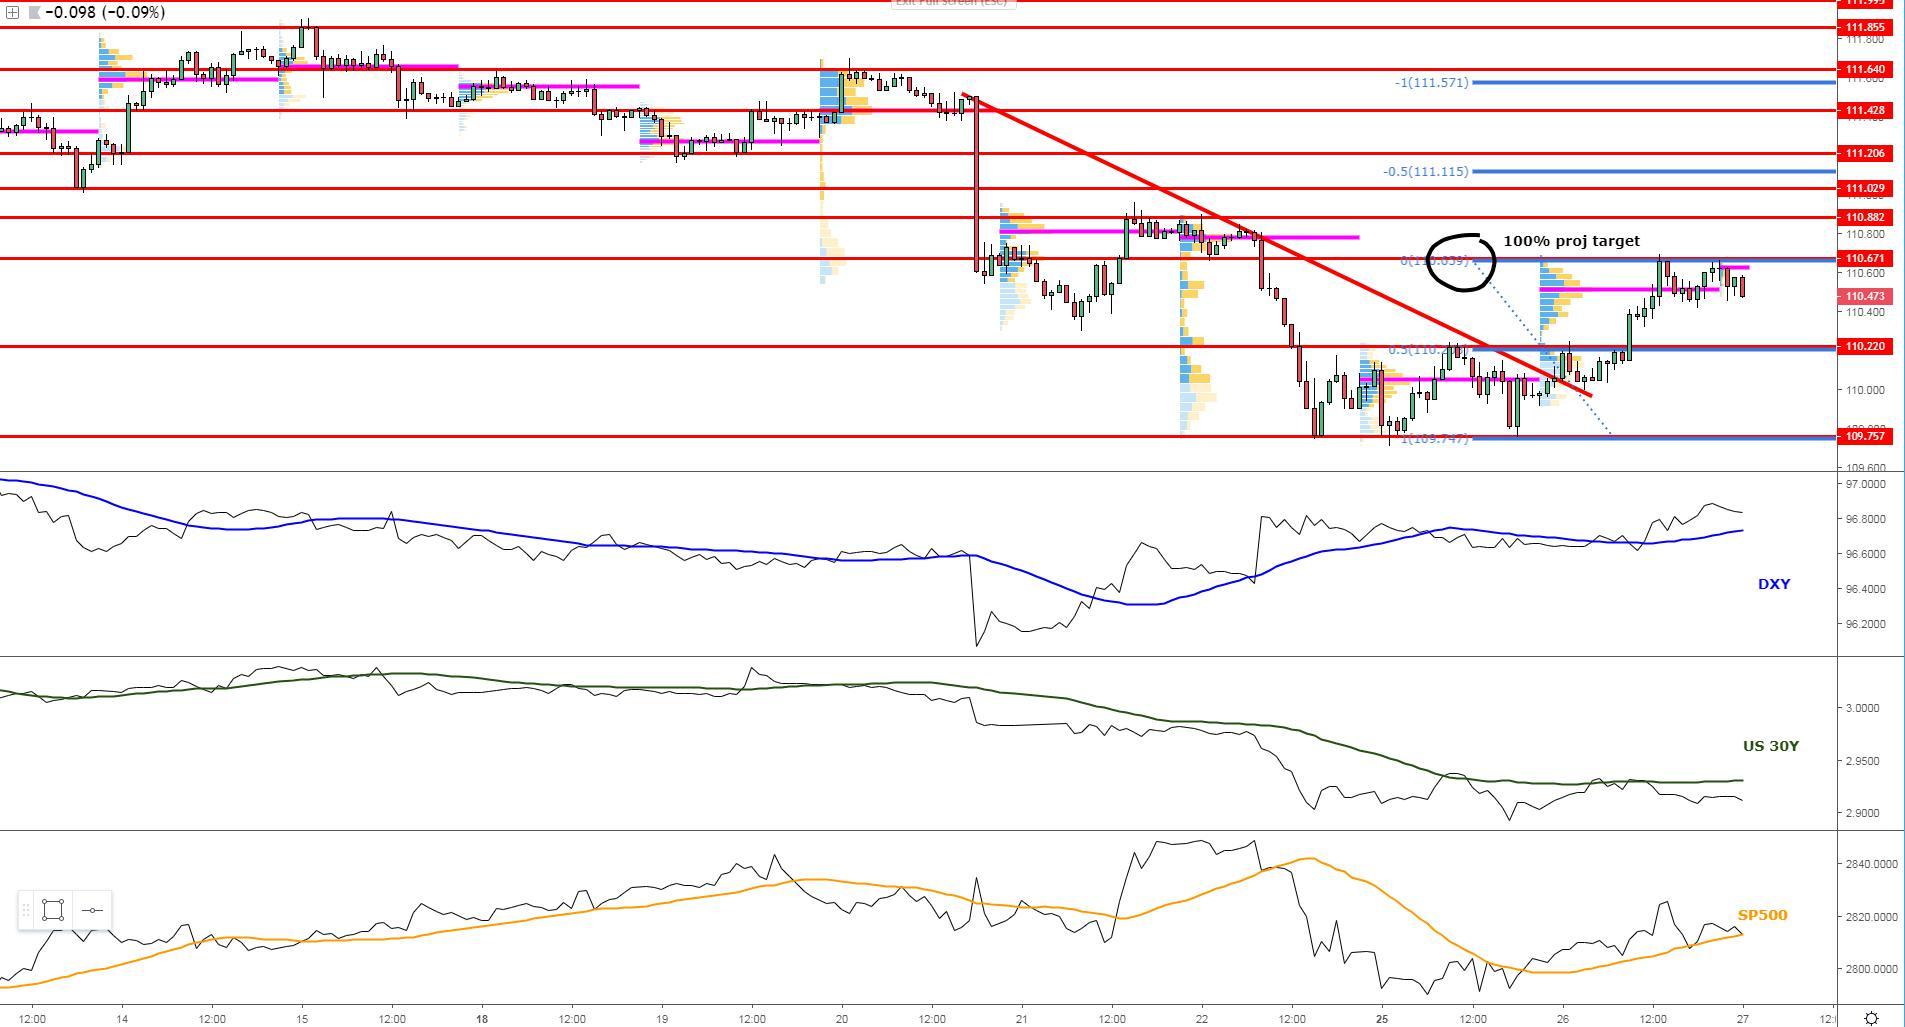
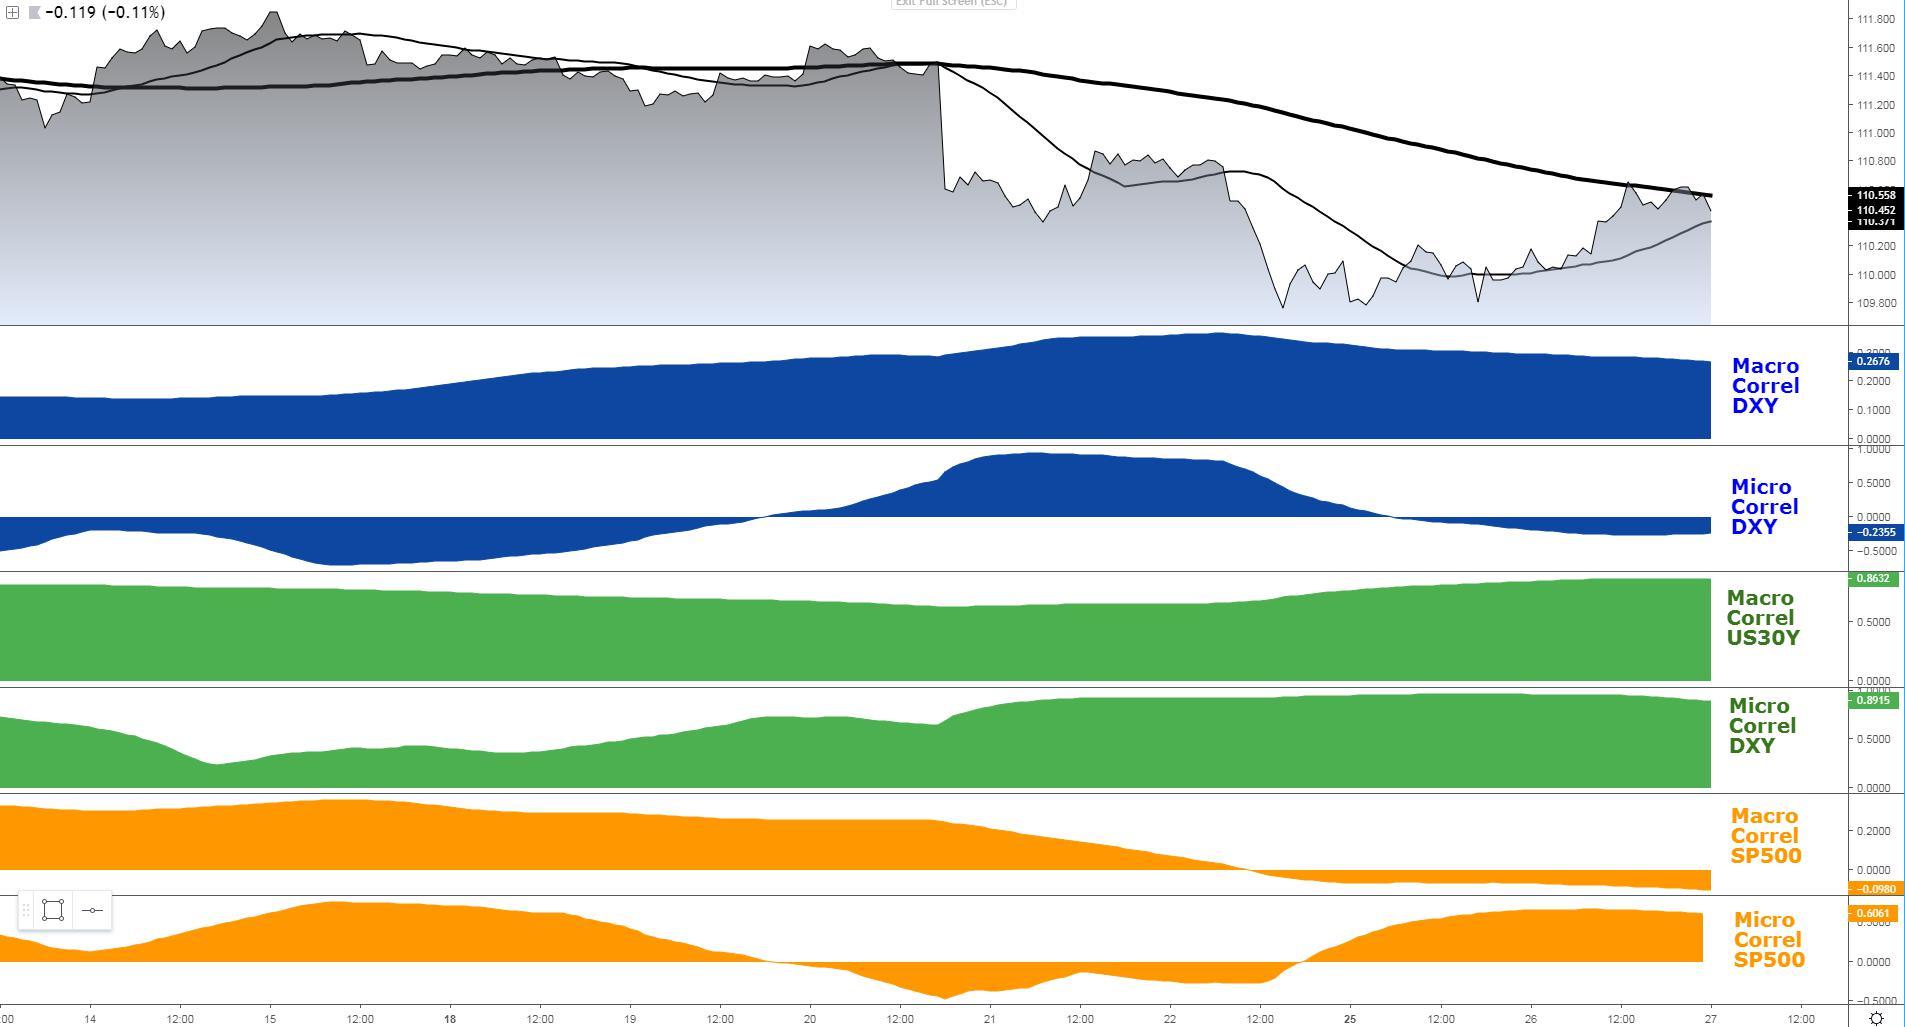
USD/JPY: Project Target Reached, P-shaped Volume Profile
The technical breakout and backside retest of a descending trendline originating off March 20th set into motion a cascade of bids that eventually saw the market meet its 100% project target. There is still a palpable risk that a turnaround at the confluent resistance level cica 110.65-70 may be seen, judging by the sub-optimal risk conditions as I elaborate in today’s RORO model. One must be prudent when putting too much weight to Tuesday’s P-shaped volume profile formation, as the pattern occurs against a rather negative technical backdrop in which breaking through 110.80-85 area should prove quite challenging judging by the accumulation of volume as represented by back to back POCs. Similarly, as long as equities stay supported and/or we can avoid the double whammy effect of lower DXY, US yields, the area of support at 110.20-25 is a candidate to find an excess of buying interest.
AUD/USD: Weak-Handed Sellers Remain Trapped
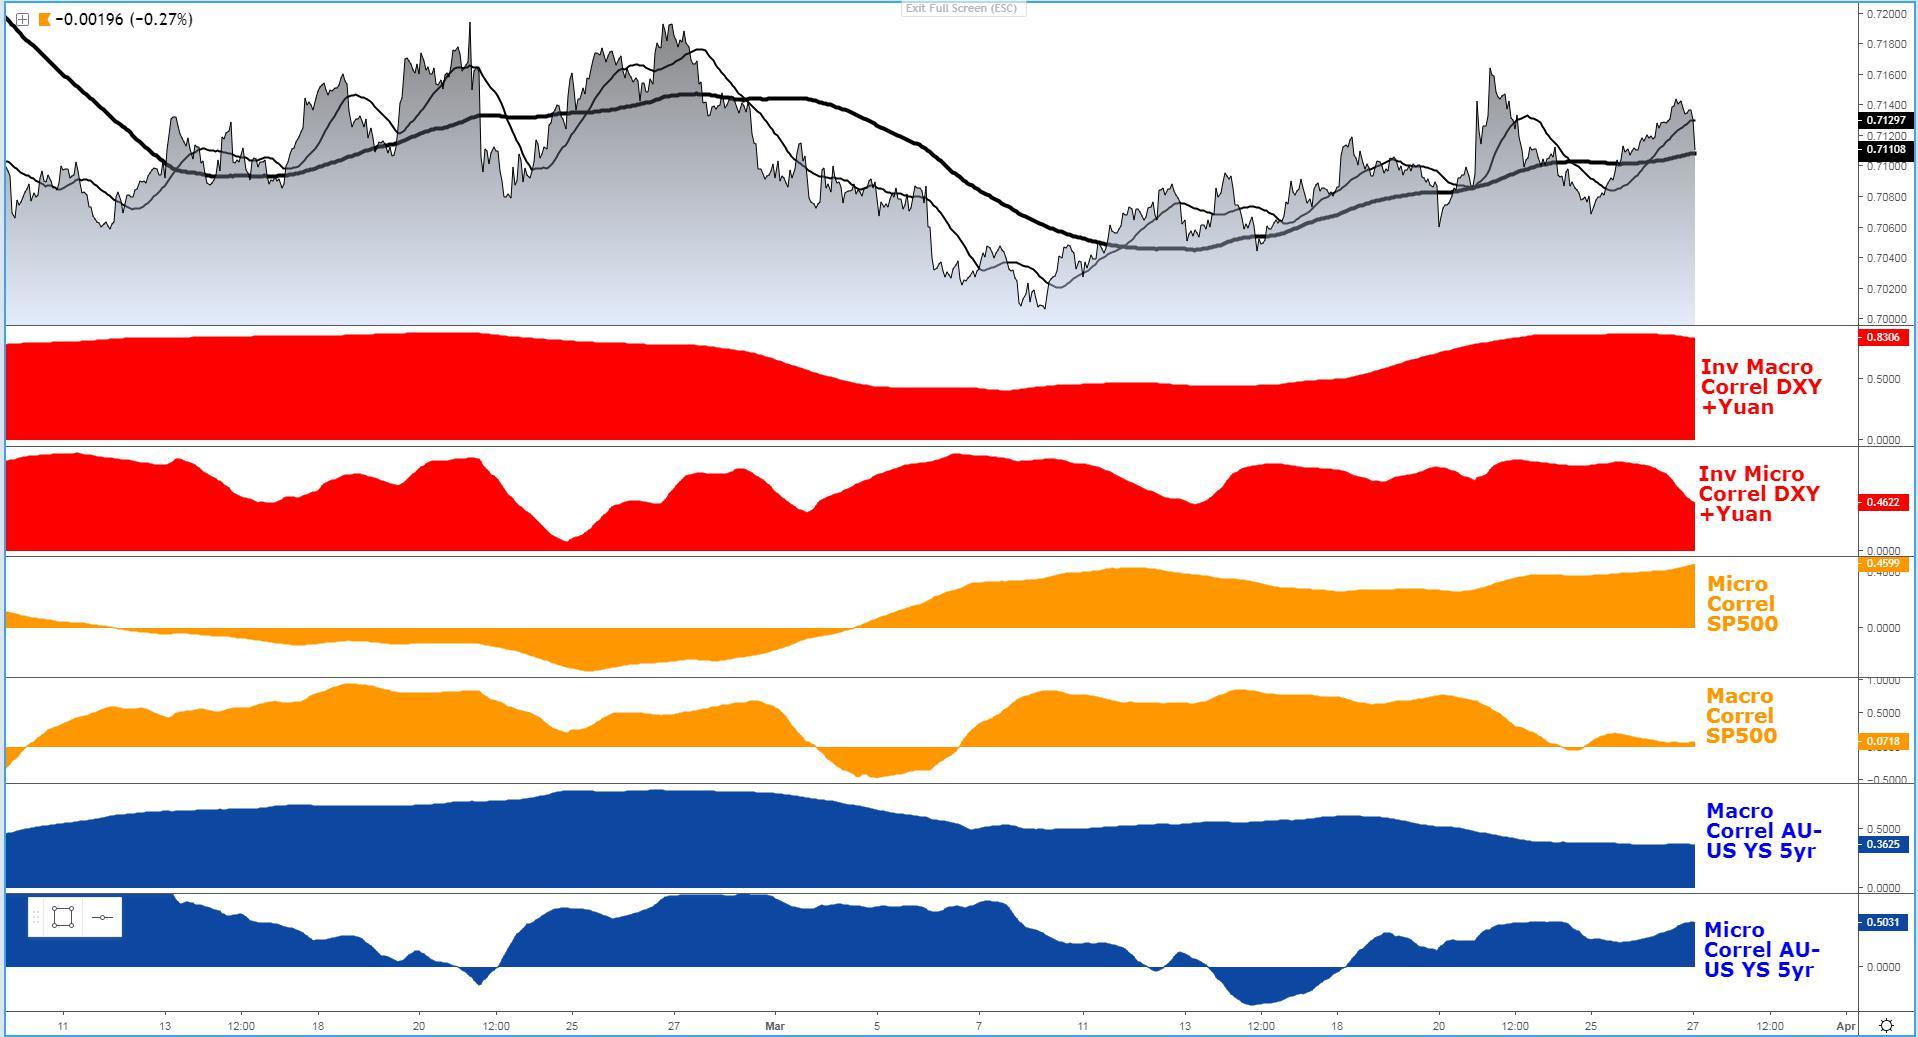
Whenever we have technicals and intermarket aligning, it’s wise to support such a direction. This is the case in this exchange rate, where the buy-side flows emanating from rising equities and the uptrend in the mid to long term maturities in the Aus-US bond yield spread acts as our guide. Such intermarket crosscurrents have so far canceled the downward pressures via DXY+Yuan (inverted). The buying interest has manifested in the formation of a double distribution up volume profile with the highest concentration of volume trapped behind the closing of price in NY. Overall, this is a market that until the positive ratio of 2:1 in intermarket flows (determined by the micro slopes) turns around, you are likely to see greater rewards by leaning against key areas of support as the promotion of higher prices remains justified for the time being. Besides, for any seller, initiating a renewed sell-side campaign ahead of the most recent swing high of 7165 looks premature from a technical standpoint. Update: Selling noted driven by the correlation with the Kiwi, whih has been knocked down on the back of a dovish RBNZ. The view on the Aussie still stands.
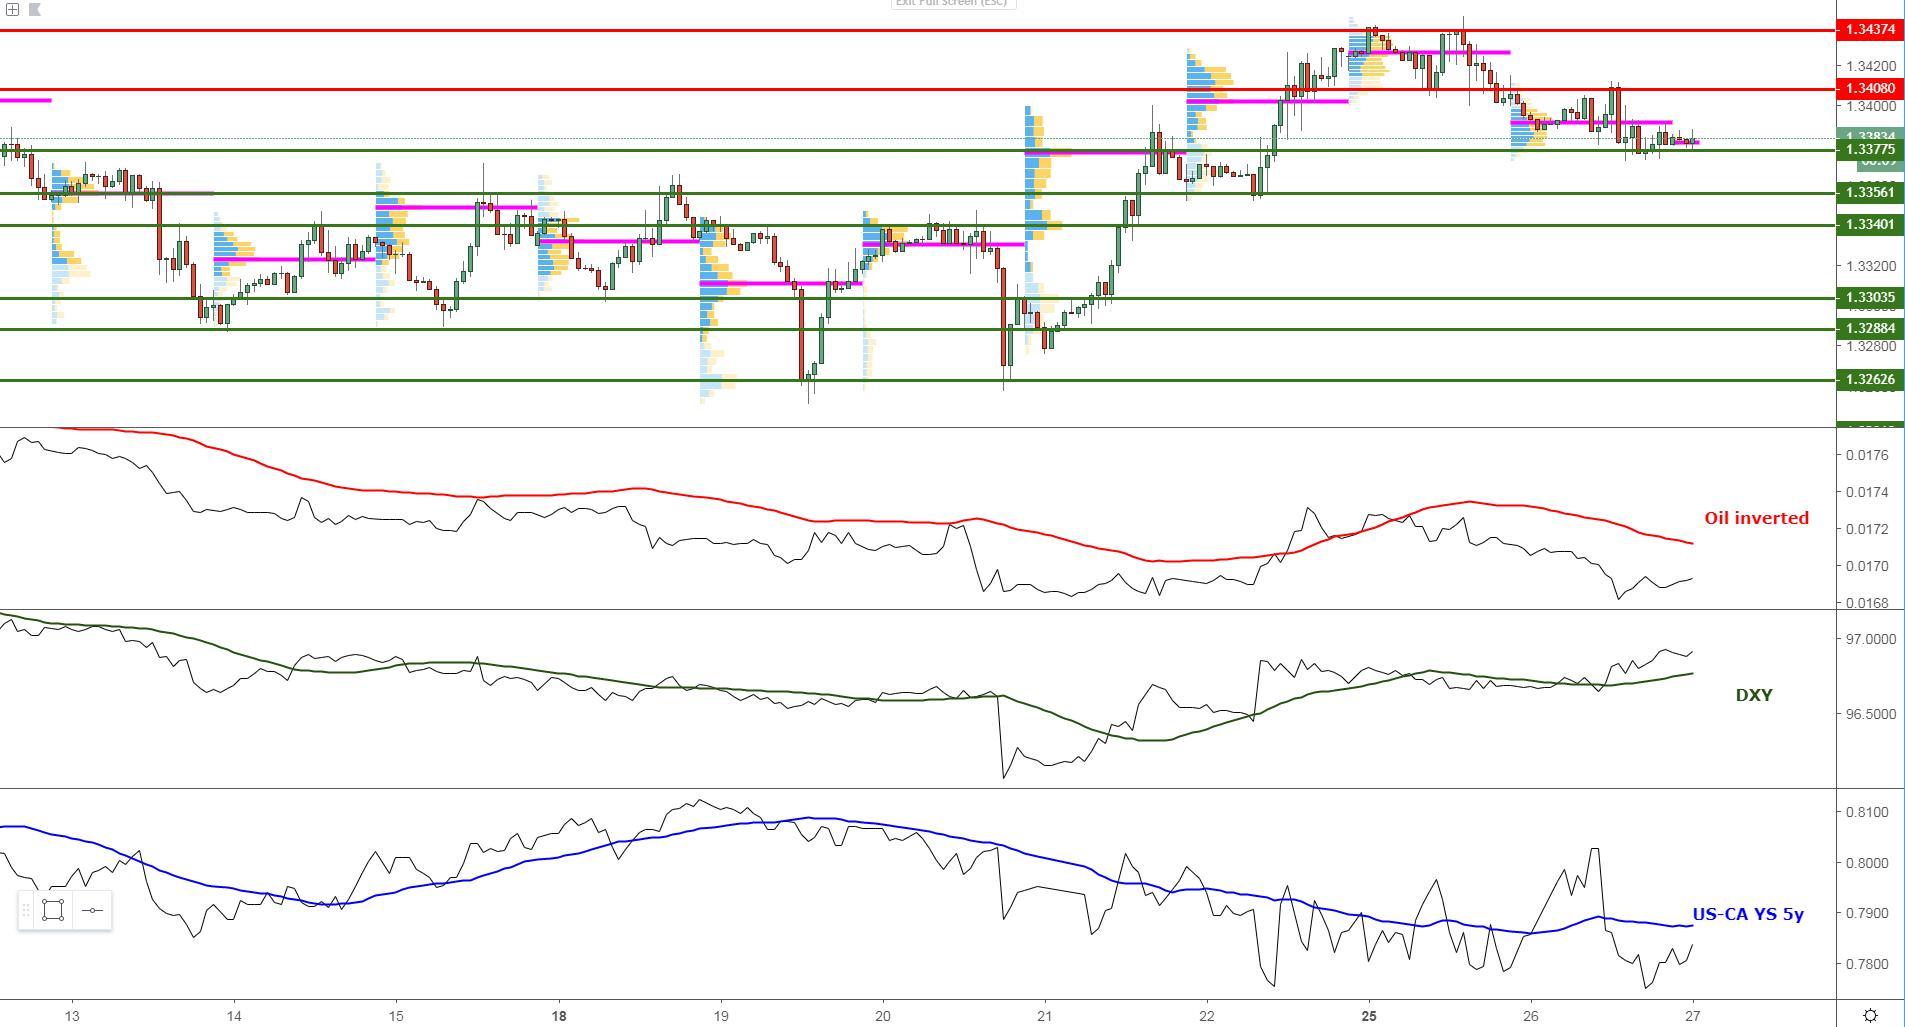
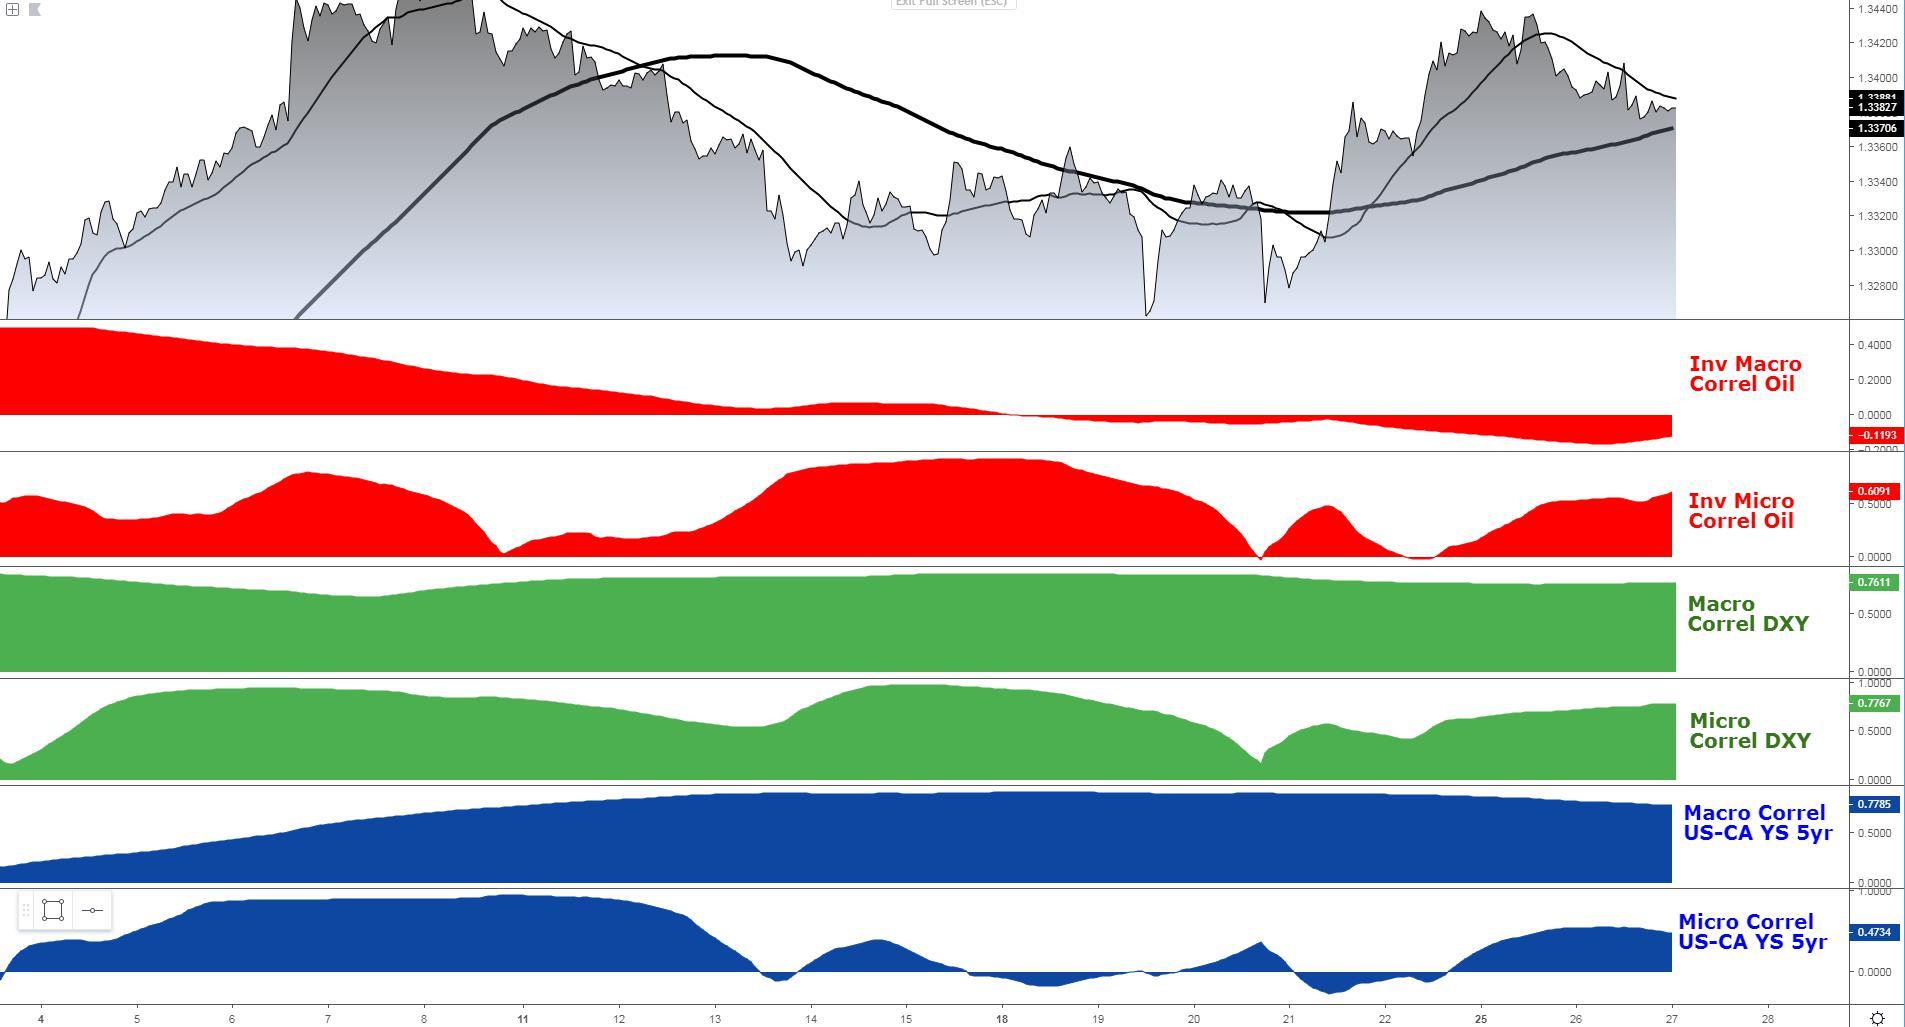
USD/CAD: Conflicting Signals, Potential Trappy Market
The exchange rate shows the pre-conditions to experience trappy & rotational movements judging by the incongruous signals obtained via technicals vs intermarket. On one hand, it’s undeniable that the buying of USD has far overwhelmed the demand towards the Loonie for the last week, leading to a bullish structure on the hourly. However, we are not yet at a stage where intermarket flows give grounds for higher valuations as Oil remains in a recovery mode (micro slope down) while the US-CA yield spread shows analogous conditions near its trend low, which in theory implies less appeal for capital flows into the US vs Canada. The only driver that still promotes a higher exchange rate is the DXY, which should not be taken for granted (far from it), as it has proven to be a much more reliable ‘leading indicator’ than Oil in recent times. Amid the clashing of intermarket vs technical cues, we ended up printing a single distribution day in the volume profile on Tuesday, which essentially constitutes a precursor to potentially get trappy price action at the edges of the 1.3375-1.3410 range.
Important Footnotes
- Risk model: The fact that financial markets have become so intertwined and dynamic makes it essential to stay constantly in tune with market conditions and adapt to new environments. This prop model will assist you to gauge the context that you are trading so that you can significantly reduce the downside risks. To understand the principles applied in the assessment of this model, refer to the tutorial How to Unpack Risk Sentiment Profiles
- Cycles: Markets evolve in cycles followed by a period of distribution and/or accumulation. The weekly cycles are highlighted in red, blue refers to the daily, while the black lines represent the hourly cycles. To understand the principles applied in the assessment of cycles, refer to the tutorial How To Read Market Structures In Forex
- POC: It refers to the point of control. It represents the areas of most interest by trading volume and should act as walls of bids/offers that may result in price reversals. The volume profile analysis tracks trading activity over a specified time period at specified price levels. The study reveals the constant evolution of the market auction process. If you wish to find out more about the importance of the POC, refer to the tutorial How to Read Volume Profile Structures
- Tick Volume: Price updates activity provides great insights into the actual buy or sell-side commitment to be engaged into a specific directional movement. Studies validate that price updates (tick volume) are highly correlated to actual traded volume, with the correlation being very high, when looking at hourly data. If you wish to find out more about the importance tick volume, refer to the tutorial on Why Is Tick Volume Important To Monitor?
- Horizontal Support/Resistance: Unlike levels of dynamic support or resistance or more subjective measurements such as fibonacci retracements, pivot points, trendlines, or other forms of reactive areas, the horizontal lines of support and resistance are universal concepts used by the majority of market participants. It, therefore, makes the areas the most widely followed and relevant to monitor. The Ultimate Guide To Identify Areas Of High Interest In Any Market
- Trendlines: Besides the horizontal lines, trendlines are helpful as a visual representation of the trend. The trendlines are drawn respecting a series of rules that determine the validation of a new cycle being created. Therefore, these trendline drawn in the chart hinge to a certain interpretation of market structures.
- Correlations: Each forex pair has a series of highly correlated assets to assess valuations. This type of study is called inter-market analysis and it involves scoping out anomalies in the ever-evolving global interconnectivity between equities, bonds, currencies, and commodities. If you would like to understand more about this concept, refer to the tutorial How Divergence In Correlated Assets Can Help You Add An Edge.
- Fundamentals: It’s important to highlight that the daily market outlook provided in this report is subject to the impact of the fundamental news. Any unexpected news may cause the price to behave erratically in the short term.
- Projection Targets: The usefulness of the 100% projection resides in the symmetry and harmonic relationships of market cycles. By drawing a 100% projection, you can anticipate the area in the chart where some type of pause and potential reversals in price is likely to occur, due to 1. The side in control of the cycle takes profits 2. Counter-trend positions are added by contrarian players 3. These are price points where limit orders are set by market-makers. You can find out more by reading the tutorial on The Magical 100% Fibonacci Projection