Federal Reserve Chair Janet Yellen was prominently in the news again last week. Most of Wall Street’s ire was directed at her for her comment that “…valuation metrics in some sectors do appear substantially stretched – particularly those for smaller firms in the social media and biotechnology industries….” Imagine the temerity of the Fed Chair for looking askance at securities bearing an increasing resemblance to those that made a brief but costly appearance during the dot.com mania.
On the other hand, Wall Street largely applauded her assertion that “…valuation measures for the overall market in early July were generally at levels not far above their historical averages….” The latter comment left the investment community confident that for months to come it could count on a continuing stream of new money in the context of the Fed’s zero interest rate policy.
Right or wrong, the Fed Chair is entitled to her own opinion. She is not, however, entitled to her own facts. As I have pointed out in previous valuation reviews, price-to-dividends, price-to-book value, price-to-sales and price-to-cash flow are at or very close to all-time highs but for parts of the bubble period from the late 1990s to 2007. And to use valuations from that period is to make a completely specious comparison. Investors lost huge amounts of money twice in stocks purchased at those historic valuation levels.
The accompanying graphs from the excellent Ned Davis Research service make the point very clearly. We have annotated the graphs with a horizontal line at current levels to illustrate how little time valuations have spent above where they are today. No one doing an honest appraisal can argue that these are “…generally at levels not far above their historical averages….”
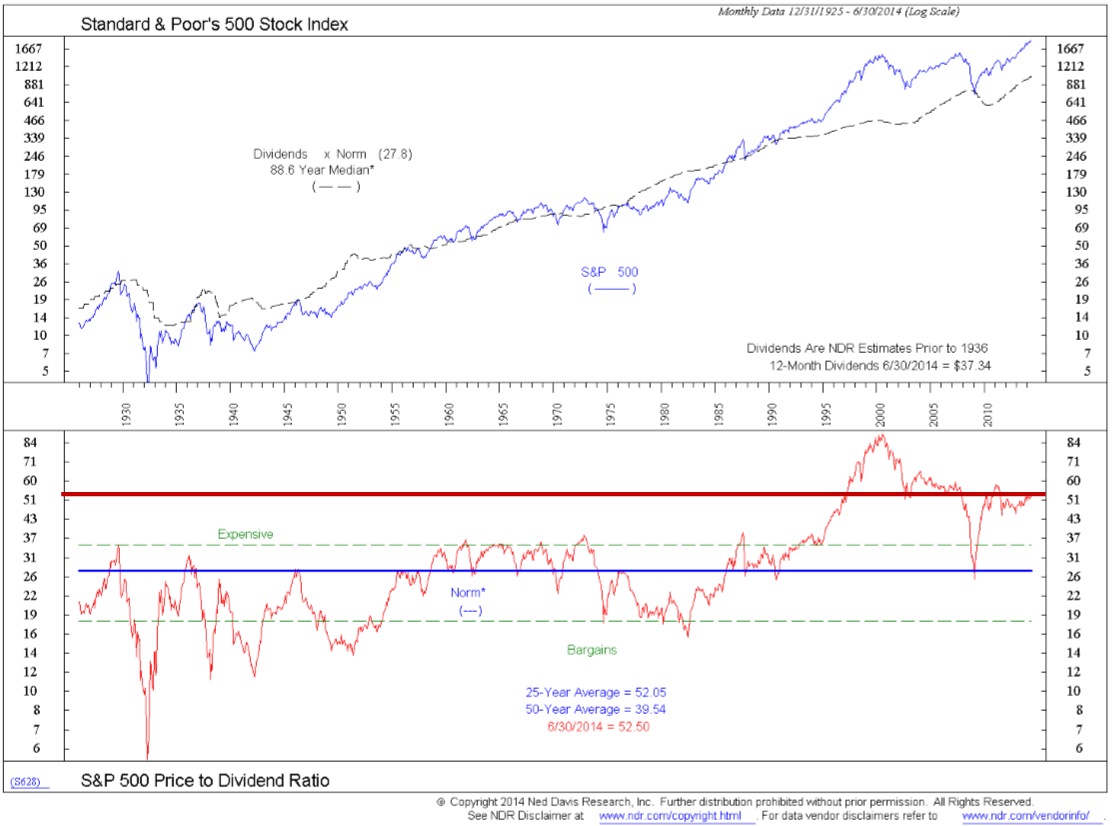
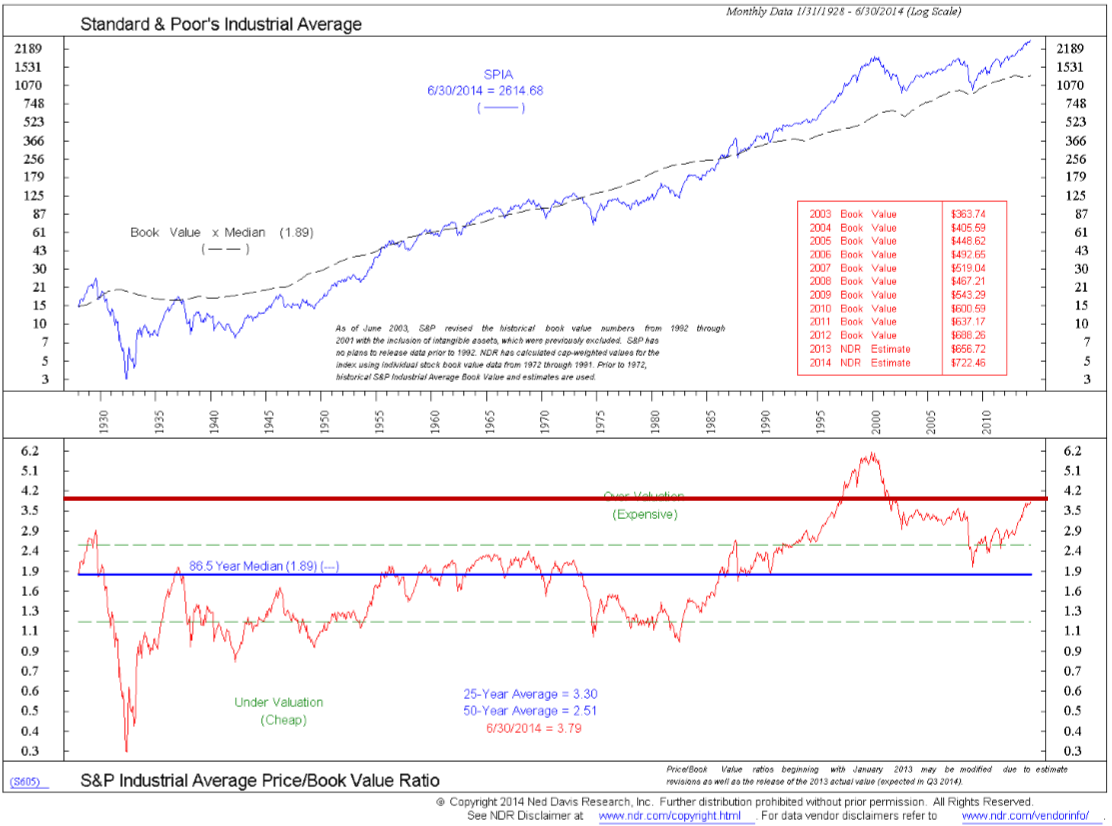
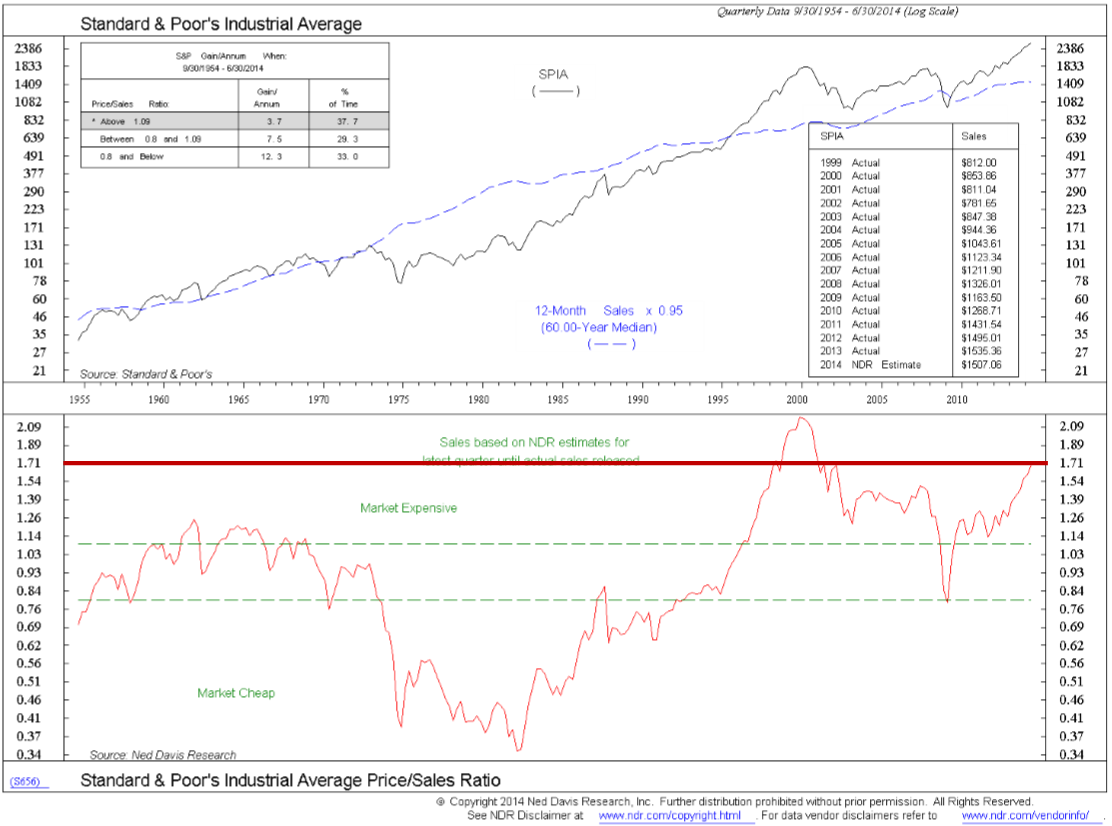
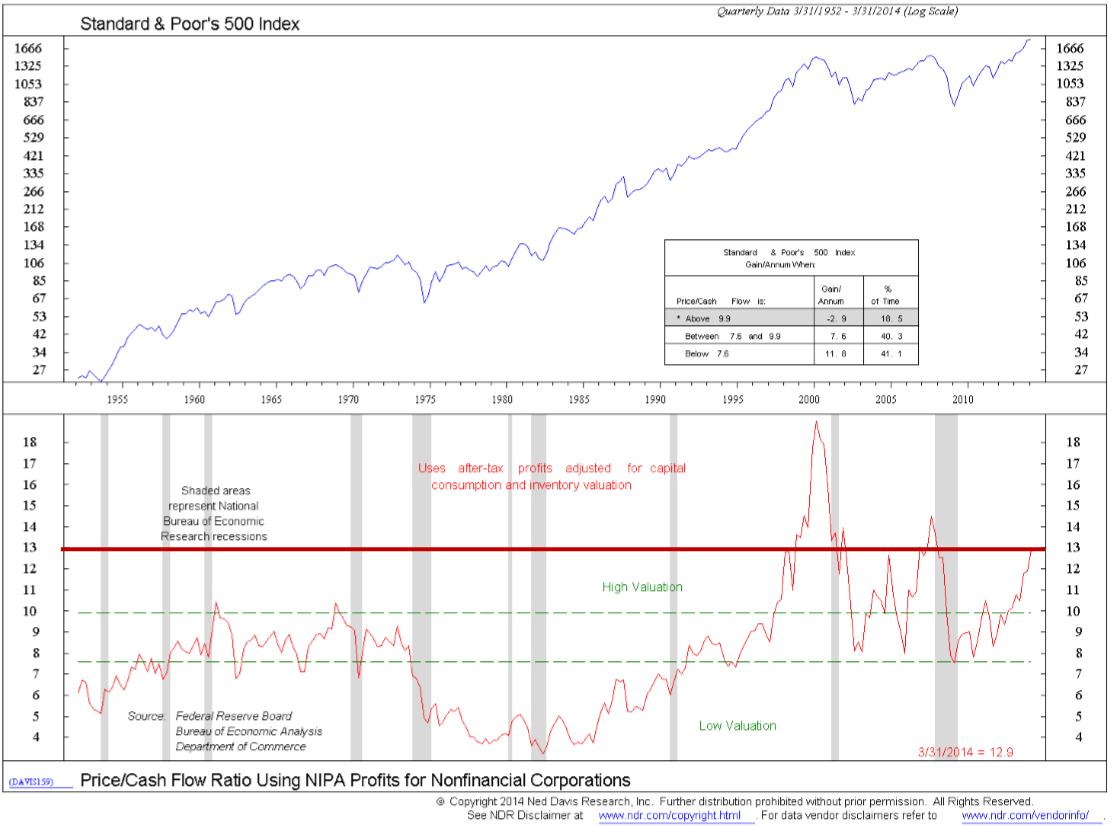
Price-to-earnings (Graph 5) is the measure of value most easily “engineered”, and it is the only one of the most commonly used measures that is not extreme. It is just very high and in the neighborhood from which most of history’s bear markets have begun.
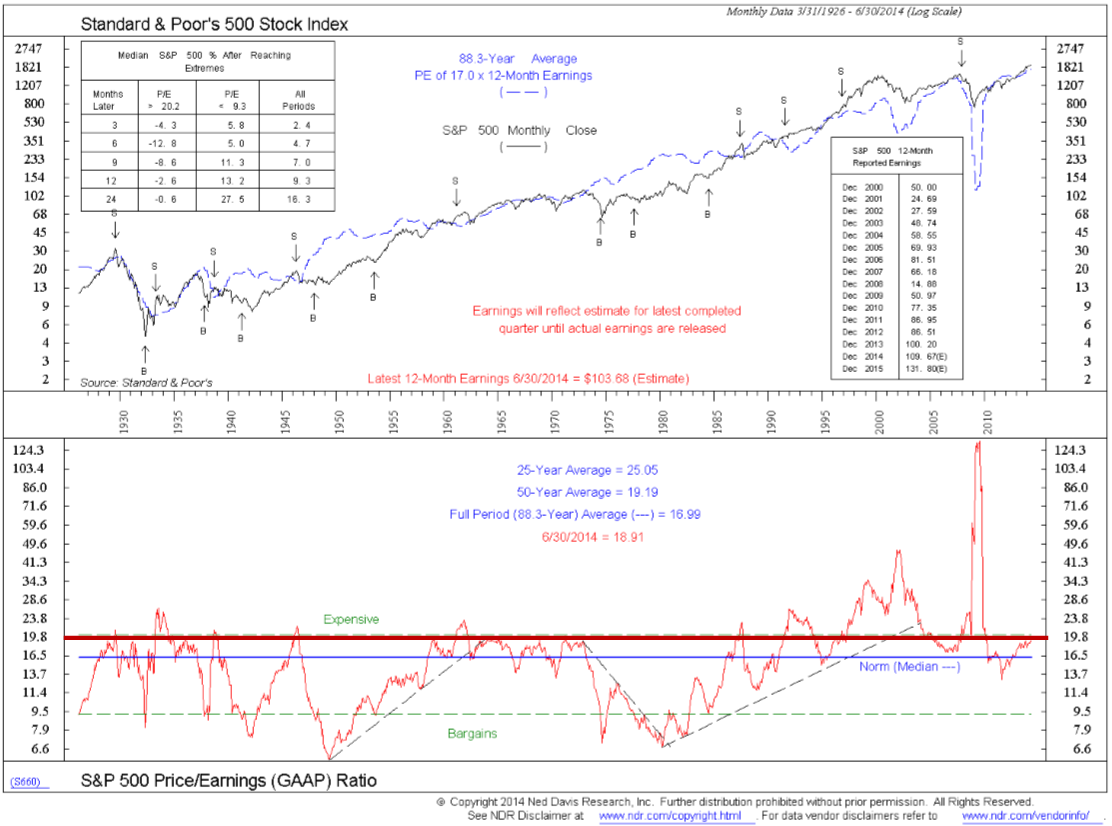
Of course, a composite of valuation measures near historic highs does not indicate an imminent bear market. As the dot.com era conclusively proved, disbelief can be suspended for remarkably long periods of time. We do, however, have dozens of decades of data verifying that stocks bought at far above average valuations produce far below average multi-year returns. Precipitous and long lasting market declines also tend to start from similar environments in which valuation warning flags fly.
It is disingenuous at best for the Fed to claim that current valuation measures are anything but dangerous.
