Updated XRP/USD trading scenario. Key levels and the most likely future Ripple price moves.In this post I applied the following tools: fundamental analysis, all-round market view, indicators and oscillators, key levels, trendline analysis, Tic-Tac-Toe chart.
I go on my series of cryptocurrency price predictions for Ripple. I’ll analyze the fundamental factors and the features of XRP/USD technical analysis that are to explain the current market state.
But, first, let’s see how accurate my forecast was last month and compare it with the actual Ripple state.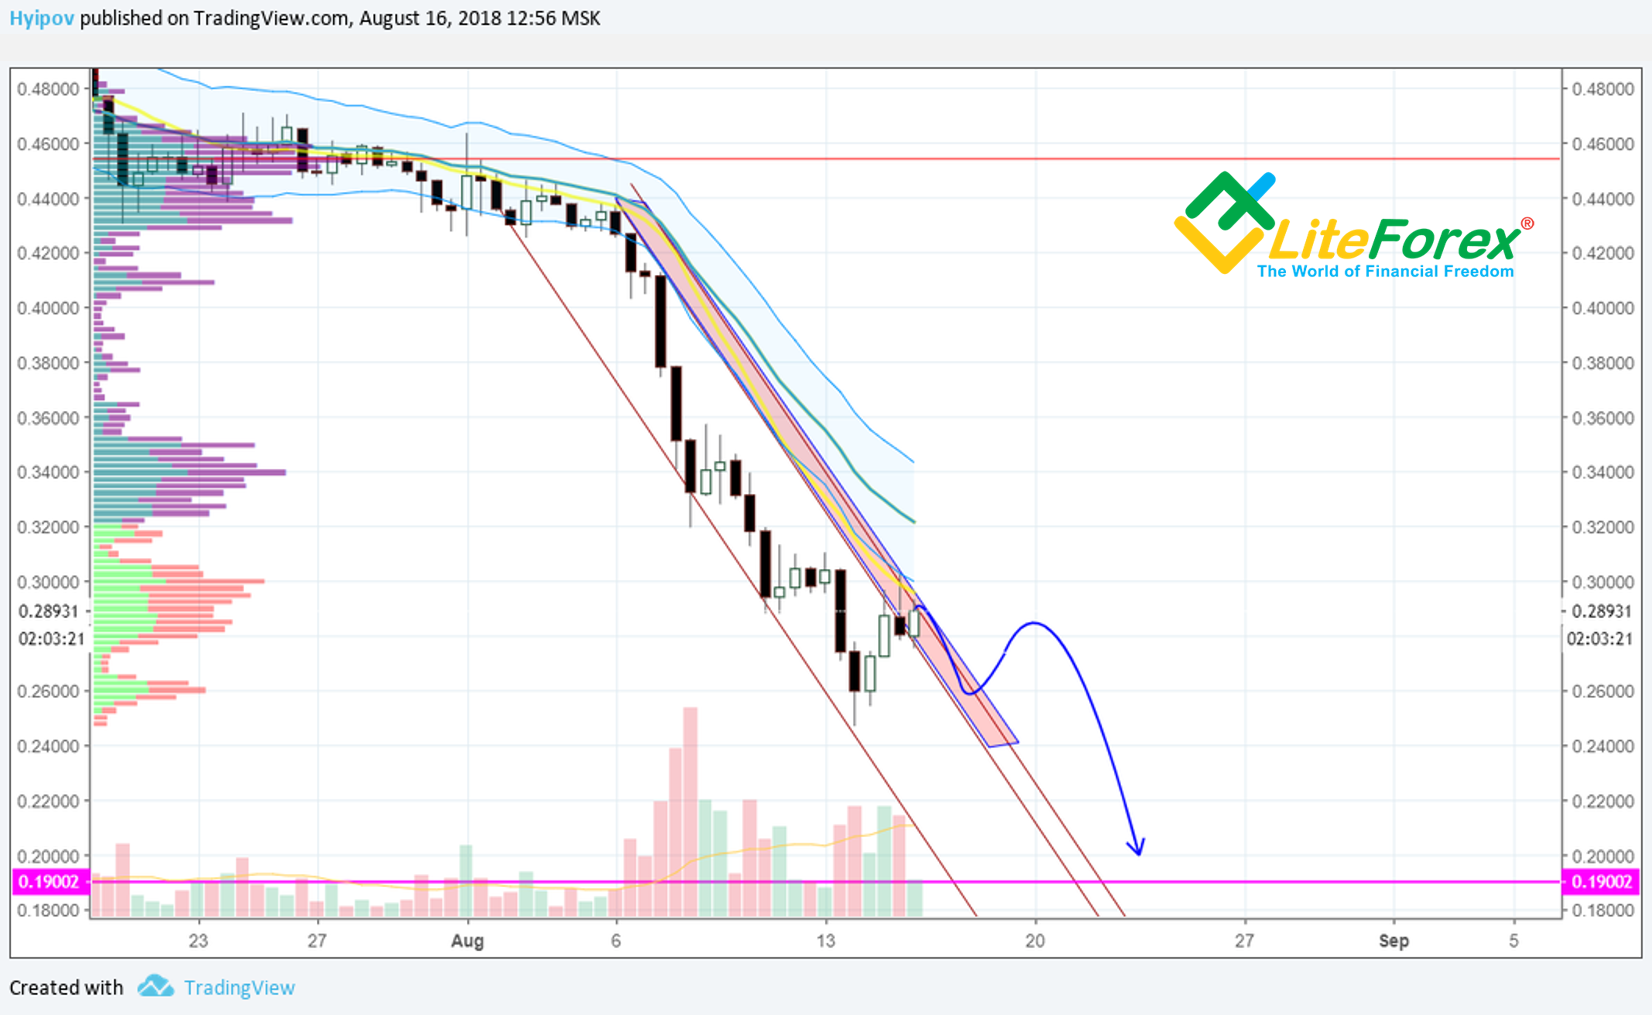
XRP/USD, dated 16.08.2018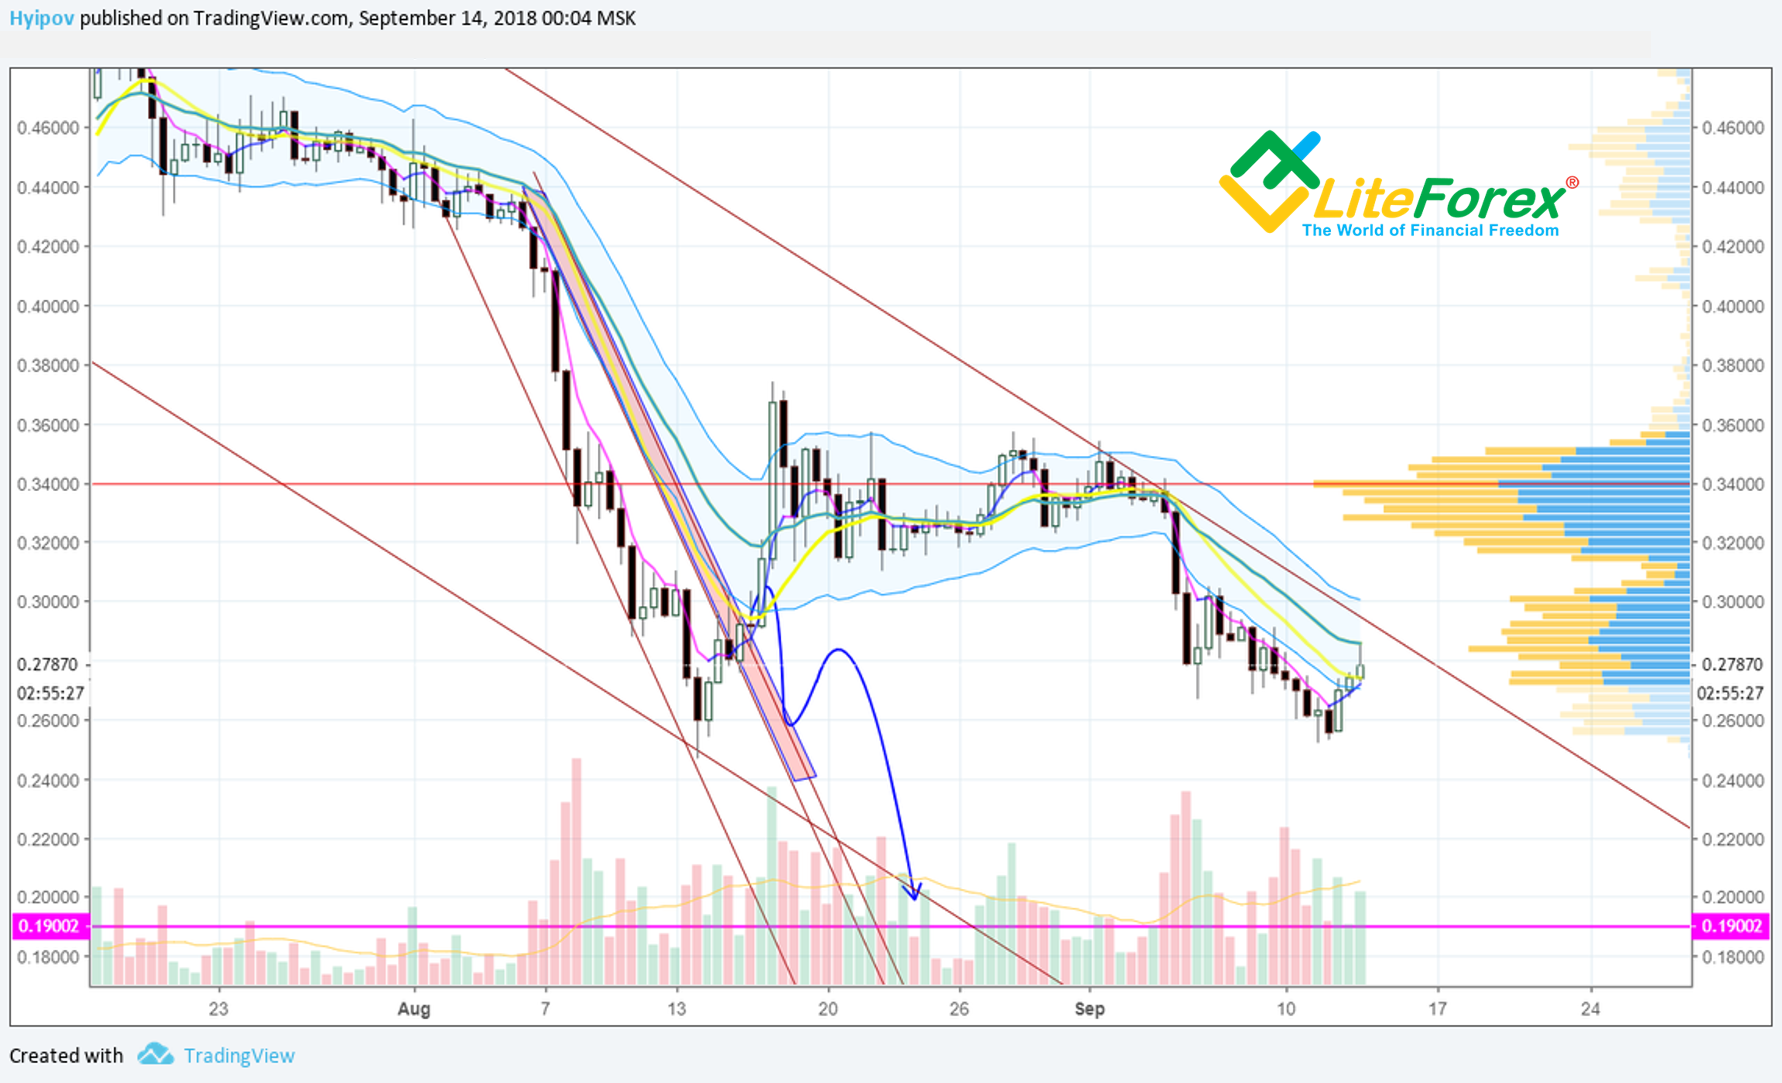
XRP/USD actual situation on 14.09.2018
As you see from these two Ripple price charts, the actual XRP/USD price went in the opposite direction from the very beginning, strongly different from the main scenario.XRP/USD fundamental analysis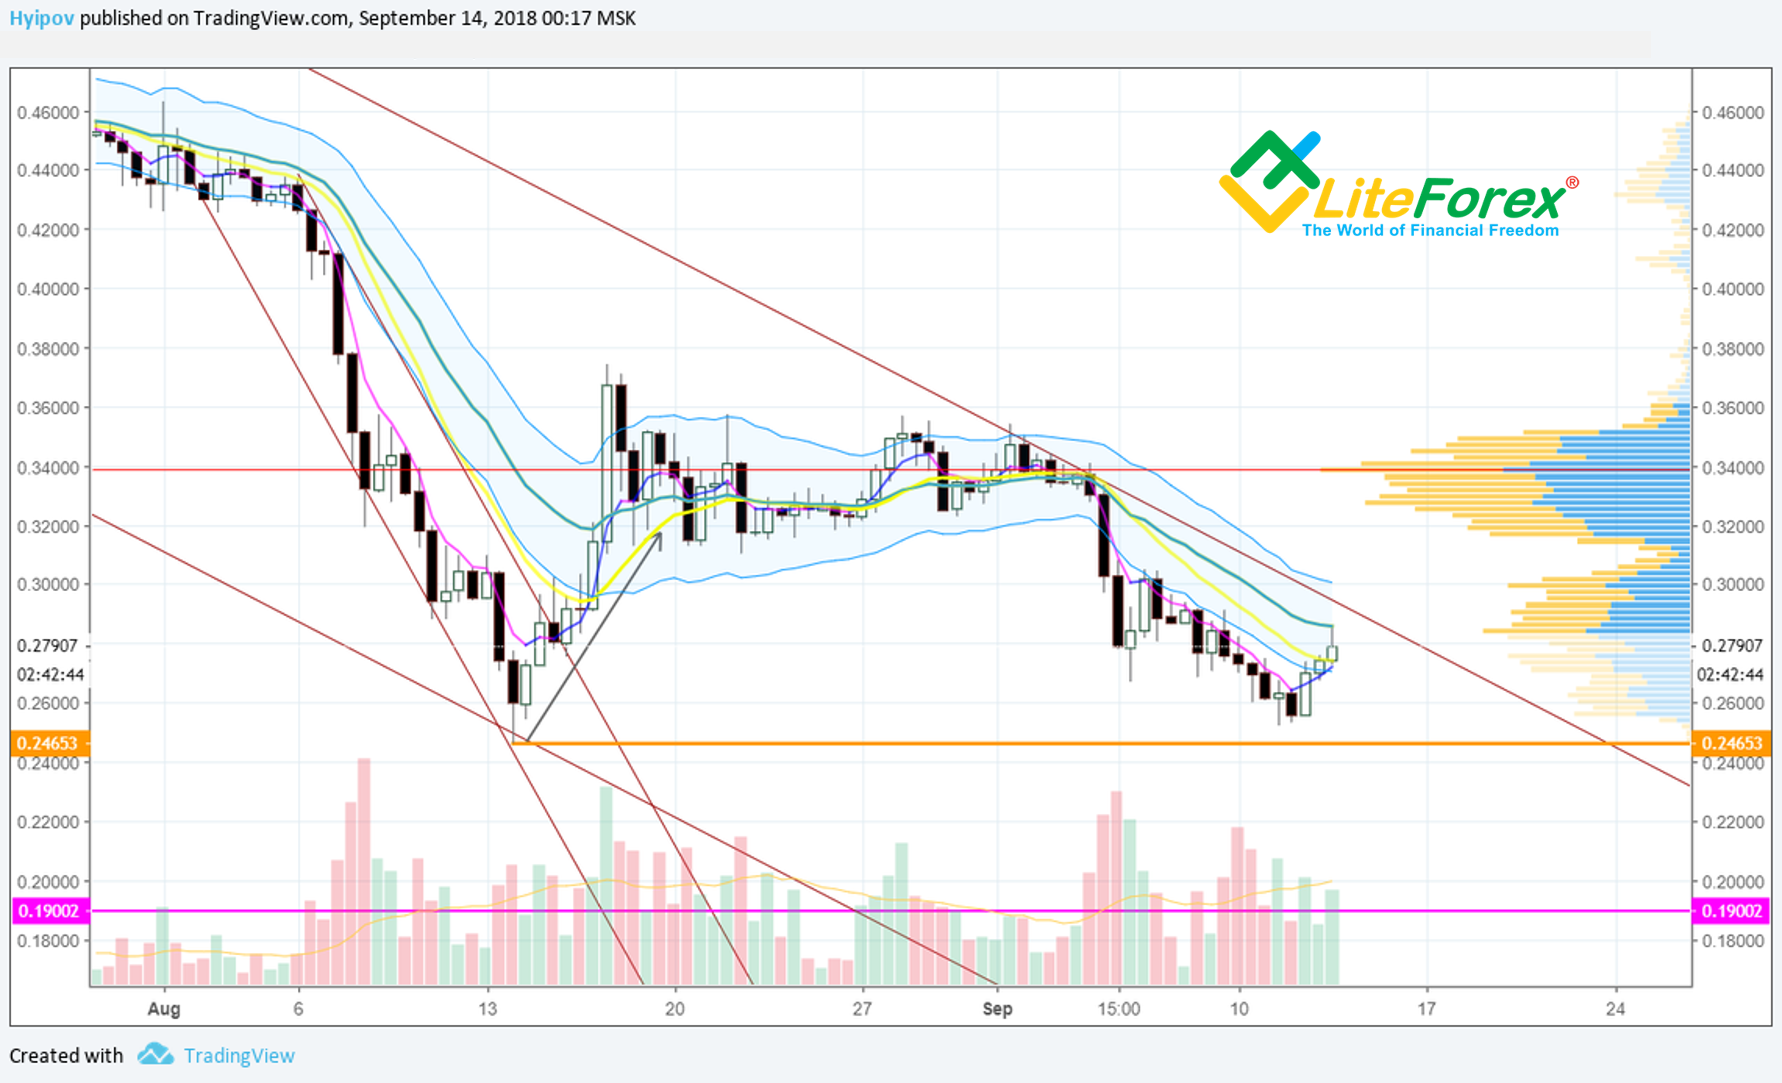
As you see from XRP price chart above, the key pivot point for the XRP/USD trend was August 13.
That day, the U.S. District Court, Northern District of California ruled to deny XRP investors’ lawsuit against Ripple Labs Inc that had alleged to the company manipulating its own token in the cryptocurrency market.
It seems, I was wrong about the effect of that decision, as the judicial proceedings against Ripple Labs Inc for its manipulations were initiated as early as on May 5, 2018.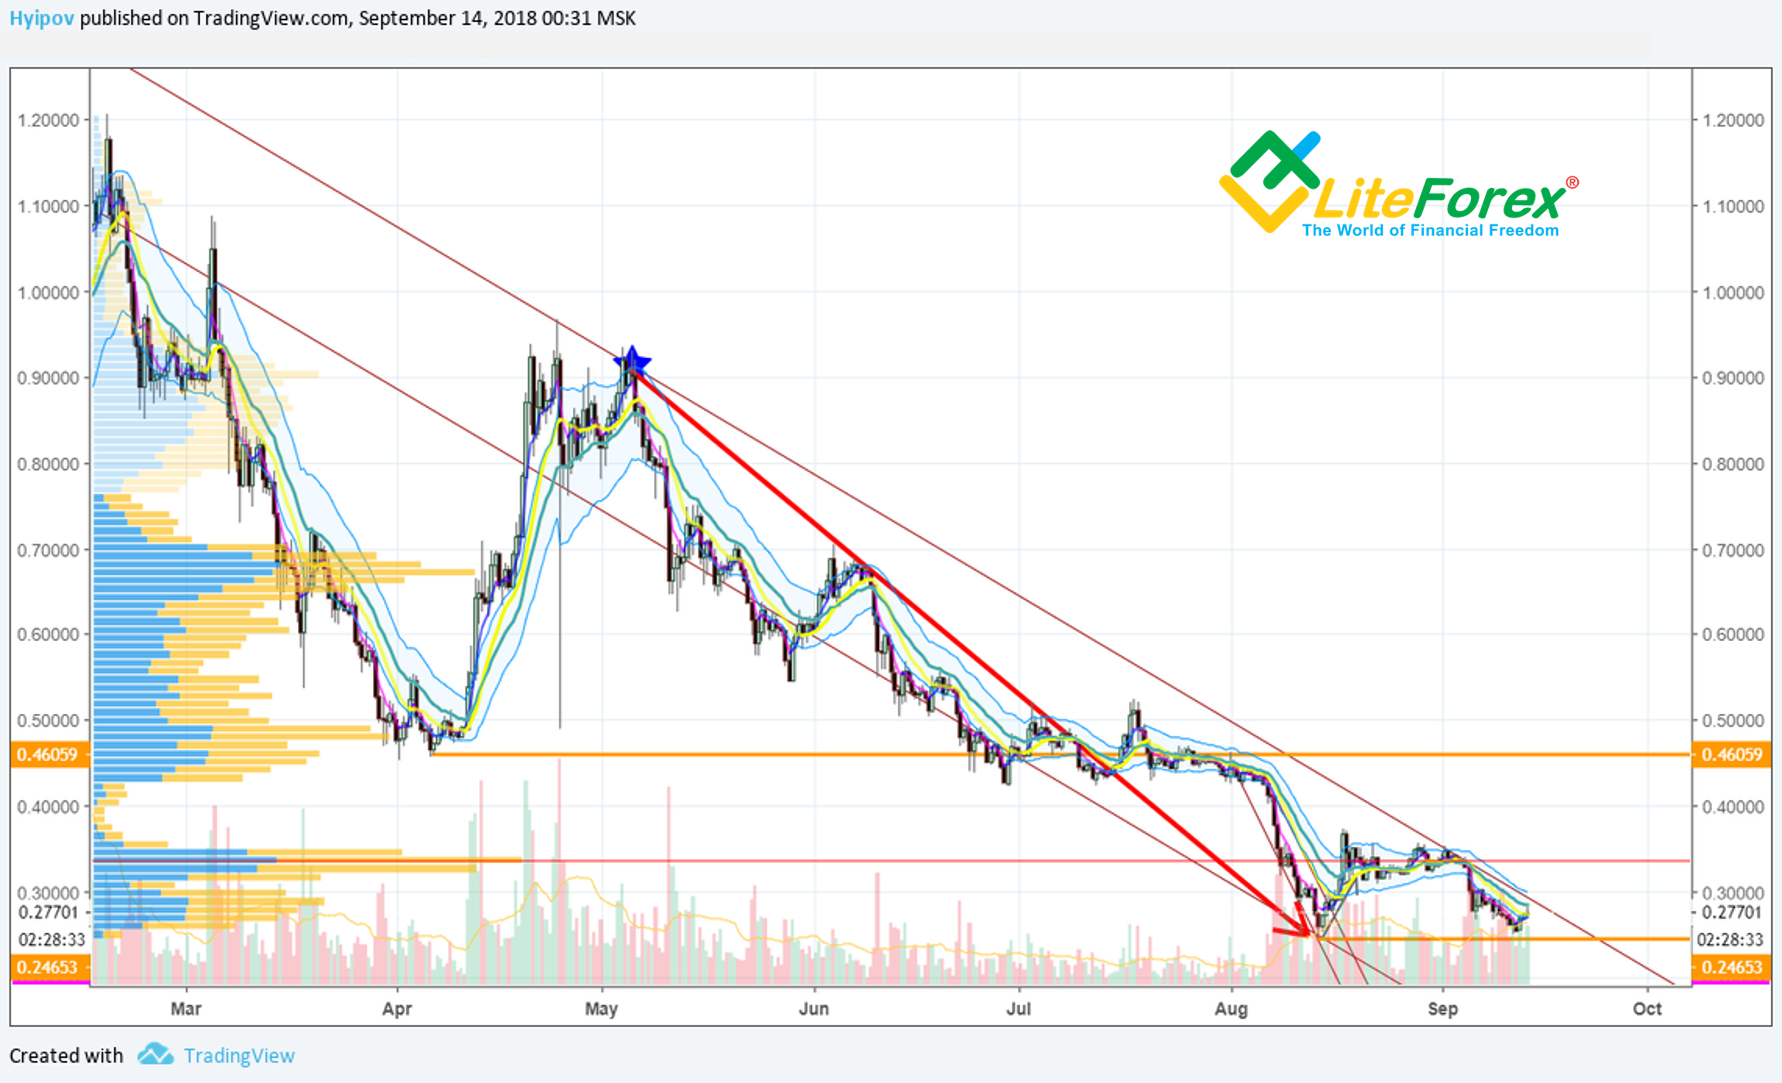
If you look at the chart above, you’ll notice that the event started a long bearish trend for Ripple to USD.
So, when the indictment is withdrawn, the main driver, pressing Ripple down, should disappear.
Not long ago, on September 11, it became known that R3 had called off its lawsuits, filed earlier in the courts of Delaware and New-York, against the same company, Ripple Labs Inc.
R3 was defending the right to buy 5 billion of XRP at the fixed price of 0.085 USD.
However, according to the recent news, the sides managed to settle down the conflict.
On the one hand, the news can be seen as certain positive, as one reason to press the Ripple cryptocurrency price down has been removed.
However, on the other hand, it is not known what the agreement the sides reached is. Its details are still concealed.
It is clear that this decision should have satisfied both conflicting sides, and so, R3 is likely to receive the desired 5 billion of XRP; but it should be about either a higher price, or dividing the amount into tranches and submitting the altcoins in installments.
Anyway, 5 billion of XRP, held by one company, will be a strong tool to manipulate the market. R3 will obviously be neither Hodler nor a long-term investor. It is interested in converting its XRPs into fiat money as soon as possible, to invest into the business development.
In other words, there is going to be a big seller of the Ripple coins that won’t let the altcoin to increase and move up.XRP/USD technical analysis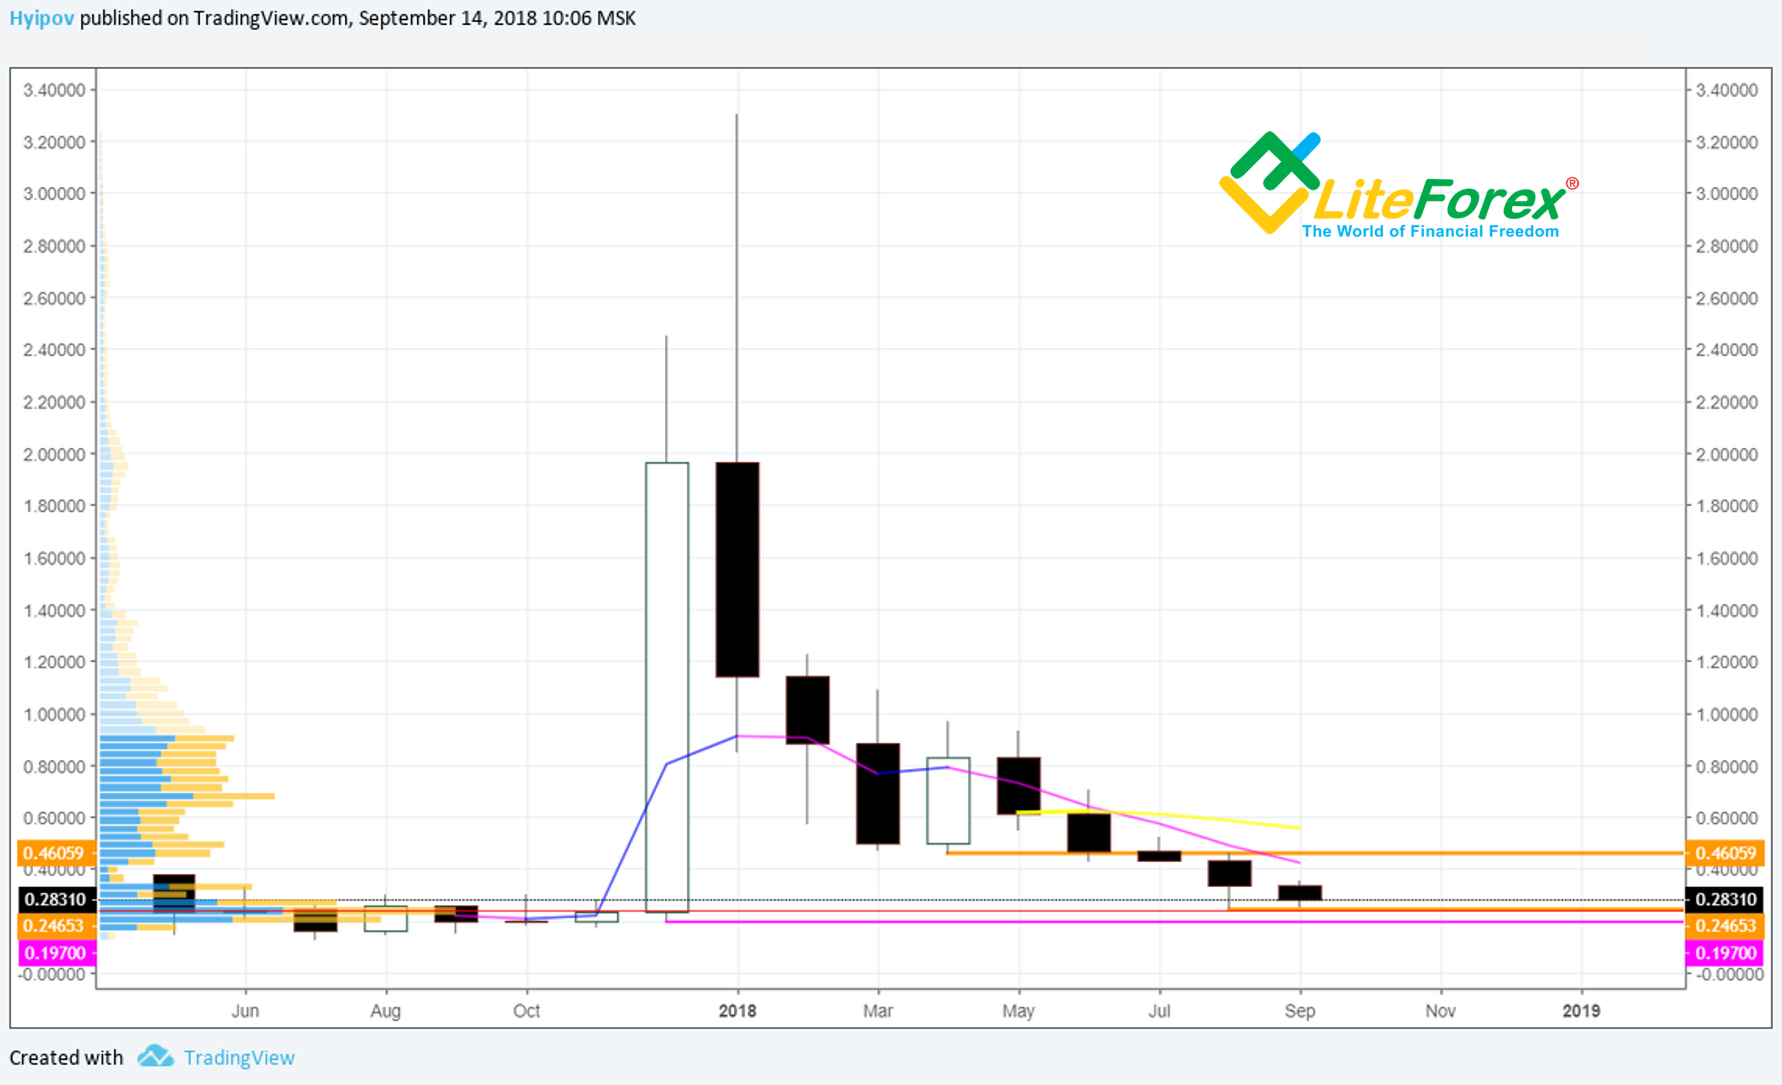
In the XRP/USD monthly chart above, it is clear that all the price movements during this month are inside the borders of the previous, August, candlestick. Besides, the low marked in December 2017 at 0.197 USD is still open.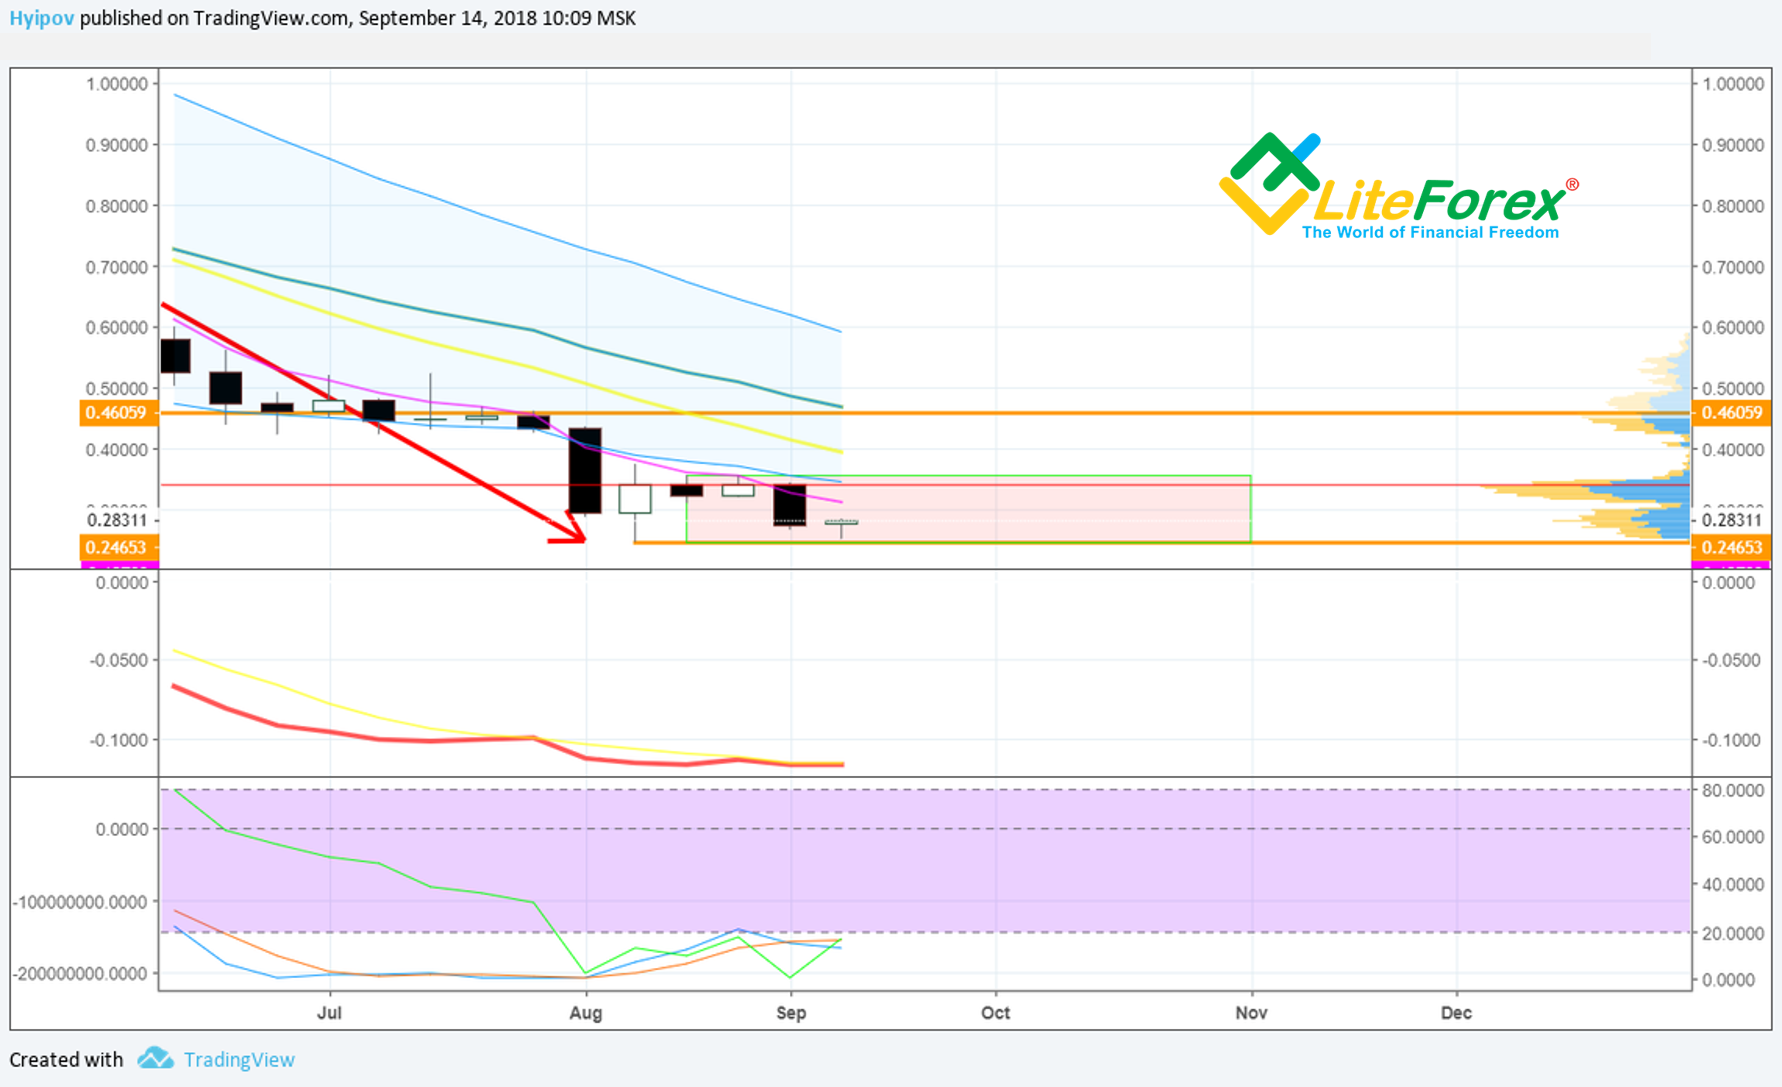
In the Ripple weekly chart above, you see that during the last four weeks, the ticker has been moving in the sideways trend. XRP/USD price is below the point of control in the volume profile.
The indicators themselves don’t suggest any kind of reversal. MACD is red, being in the oversold zone. RSI oscillator is also in the oversold zone and isn’t yet showing any signs of going up. ![]()
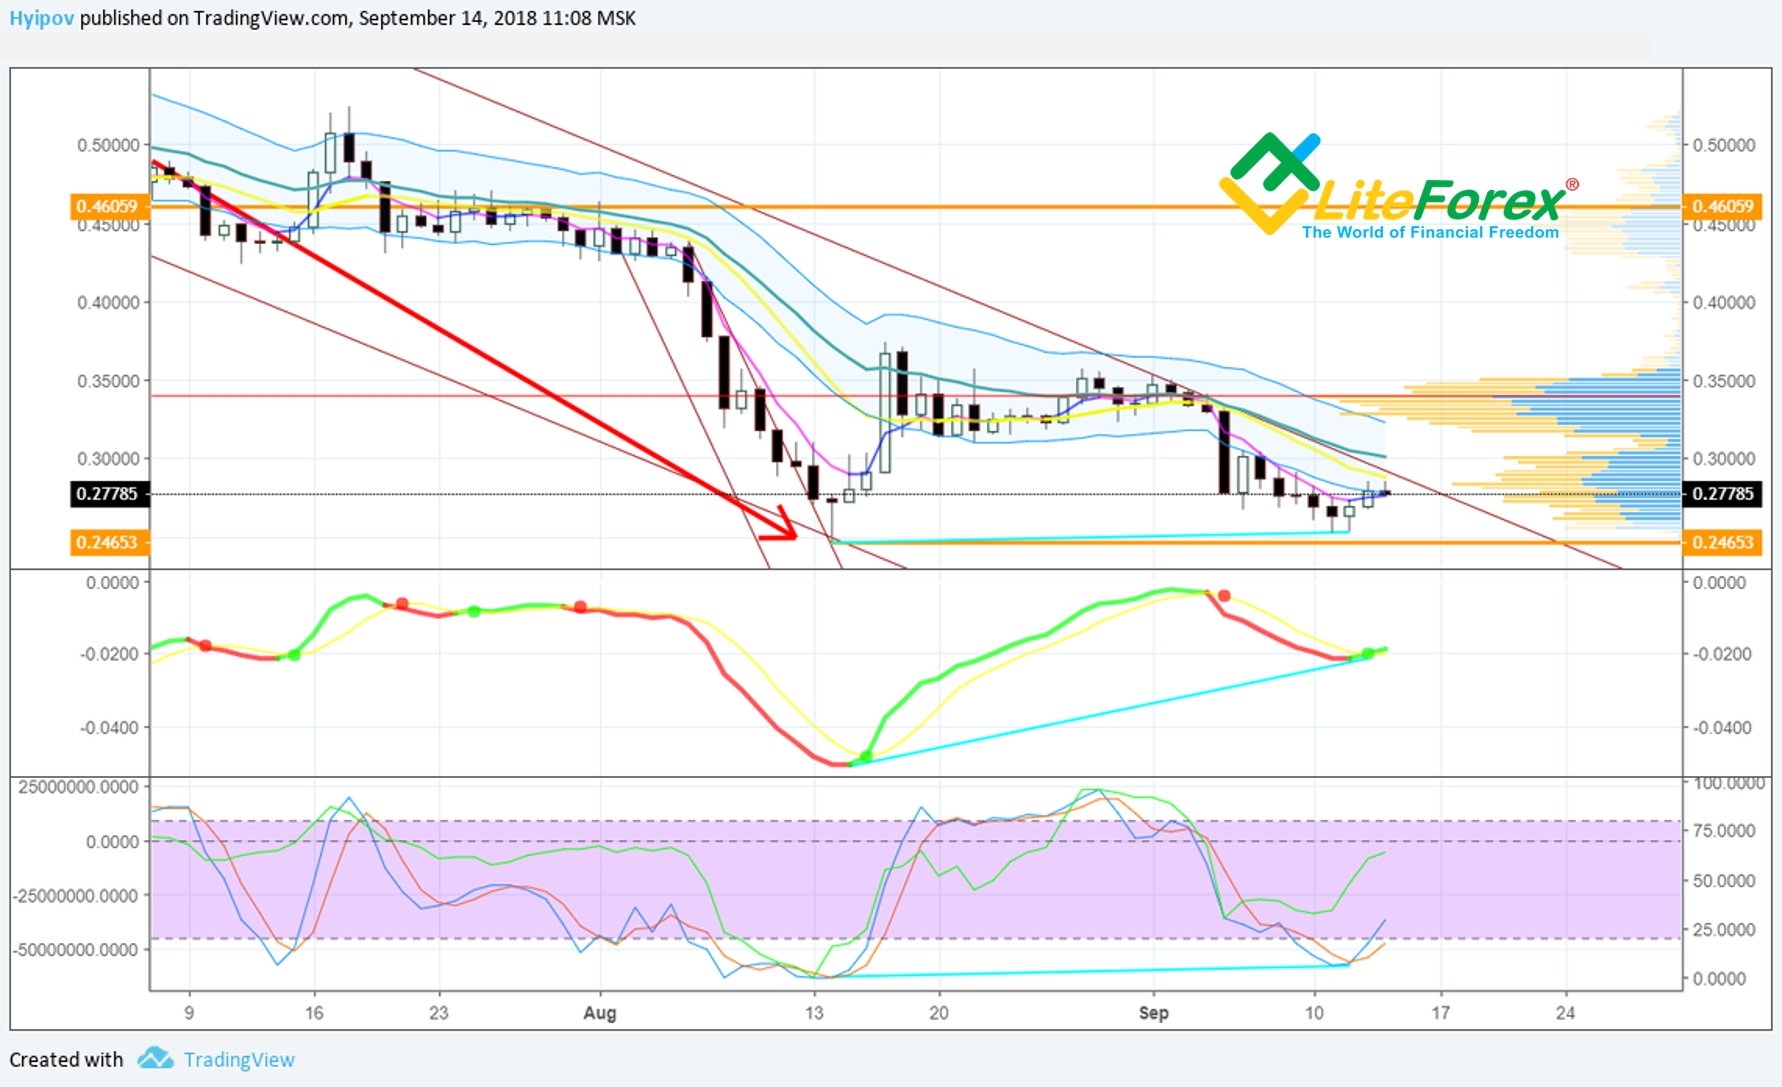
In the Ripple daily chart, it is clear that XRP/USD ticker has closely approached the top border of the downward channel. Nevertheless, there are the reversal signal, sent by RSI stochastic and MACD; it means a possible breakout of the bearish channel; it will be a good bullish signal.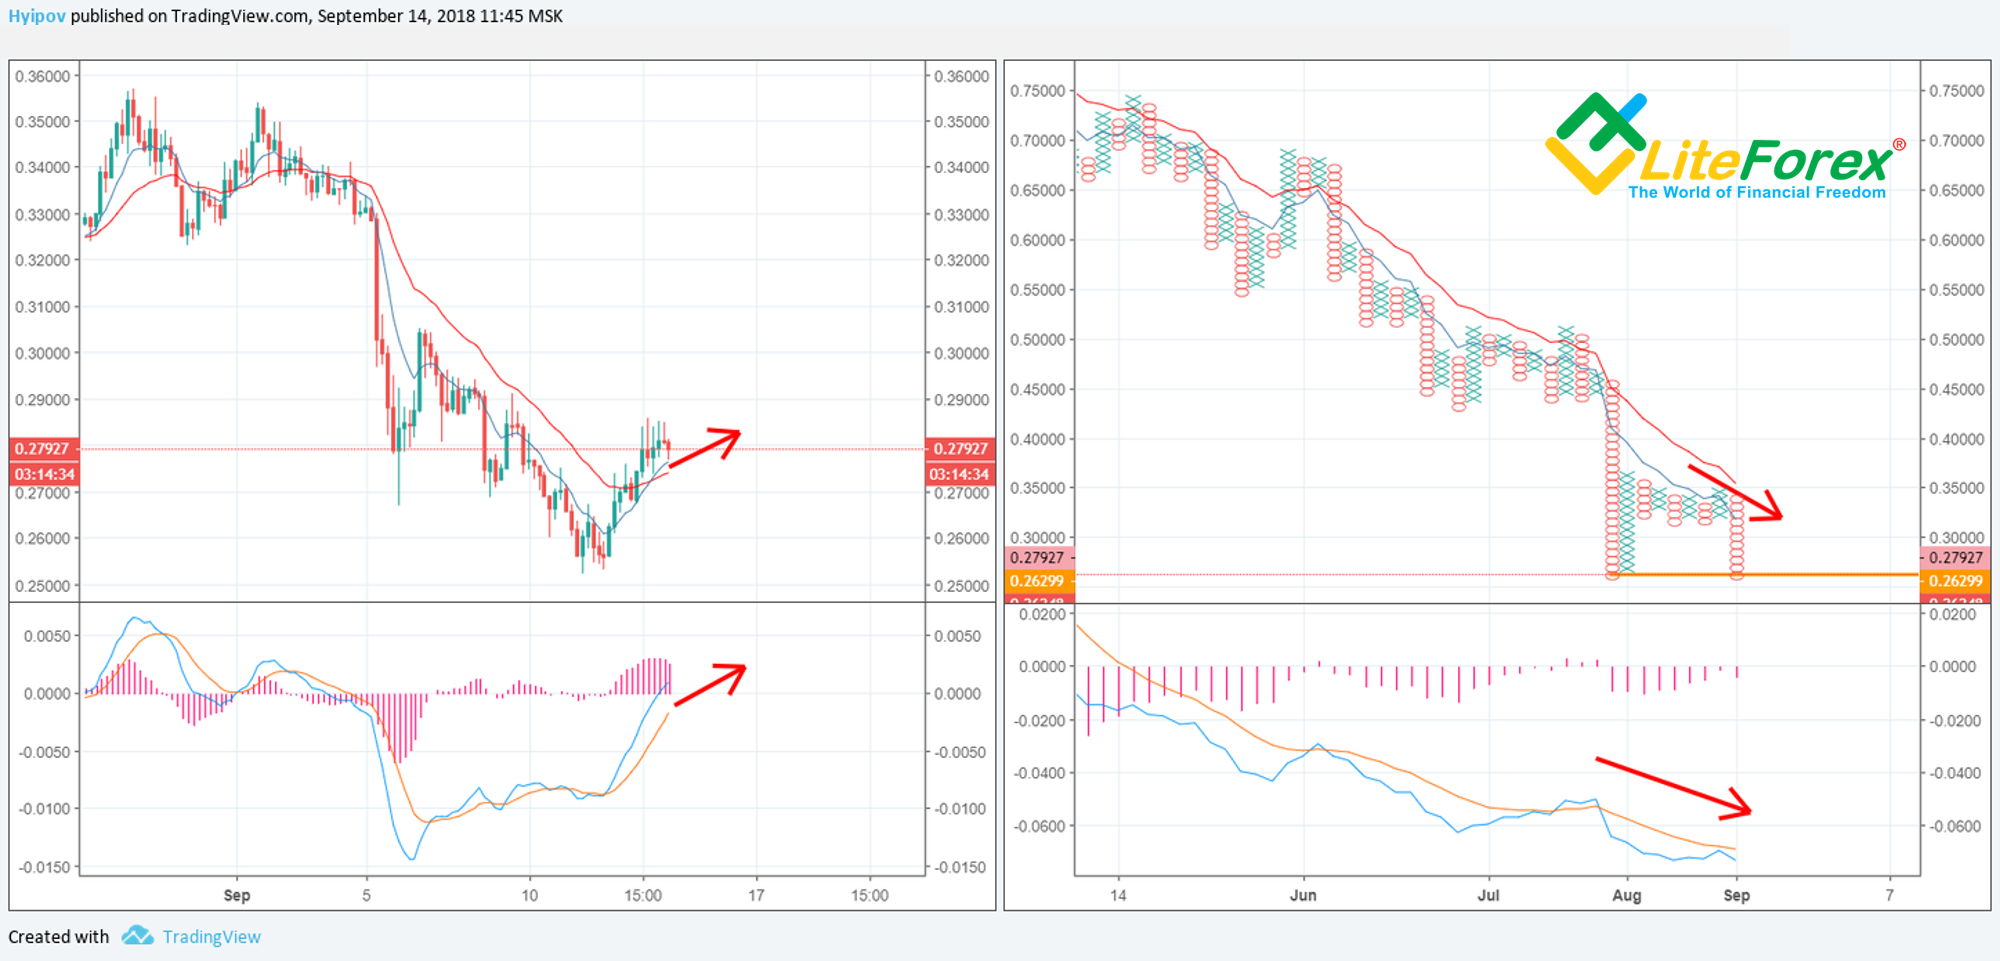
As a part of my experiment with the Tic-Tac-Toe chart, it is clear that, although the Japanese candlestick chart is indicating a bullish correction, and its moving averages have already painted a bullish cross; there is a clear bearish trend in the Tic-Tac-Toe. At the 0.269 USD, there is a clear pattern that can support the completion of the double bottom pattern and the trend reversal in the near future.Updated XRP/USD trading scenario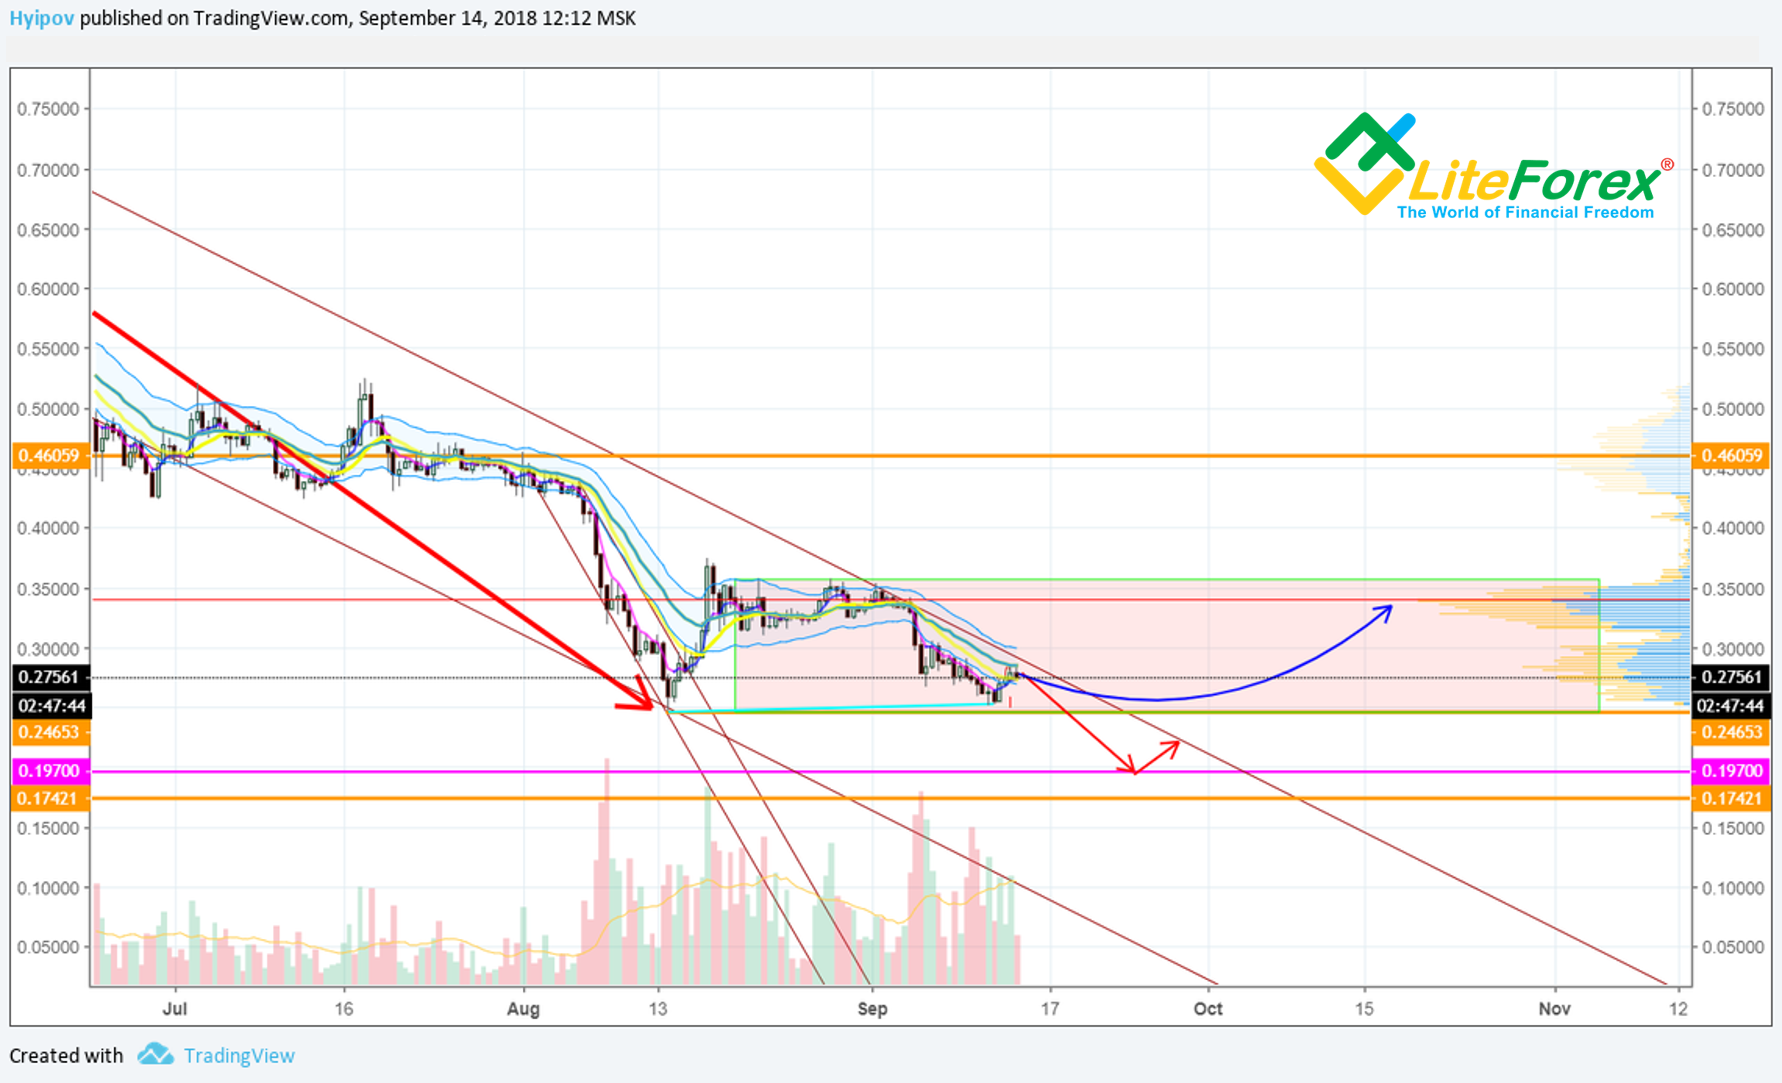
After withdrawal of the charges with manipulations, Ripple is really provided with some support; however, according to Ripple technical analysis, the ticker shows not enough positive to continue going up.
In general, there is a surge in trade volume in the chart above, so the level is supported by buyers. They will hardly let the ticker fall down much lower than the level.
The most likely XRP/USD trading scenario suggests that the ticker should be trading inside the traded channel between 0.246 USD and 0.358 USD.
This scenario will be proved if the ticker manages to break through the border of the downward channel. If it doesn’t happen, XRP/USD will go down lower, under the bears’ pressure.
The next support levels will be at 0.197 and 0.174. I marked the way to this zone with the red arrow; it is an alternative, less likely scenario for the next two weeks.
I don’t think the Ripple price will start rising fast. Even if the market sentiment sharply changes and the market starts going up fast, XRP will be lagging behind, as it has very weak fundamental reasons to drive it up significantly.
That is my XRP/USD fundamental analysis and Ripple price prediction for the near future. Go on following the Ripple rate and staying informed on the cryptocurrency market.
