After seeing the largest corrective move to the downside in a month last week the VelocityShares Daily Inverse VIX Short Term ETF (NASDAQ:XIV) has since moved mostly sideways. This is likely in anticipation of the Nonfarms Payroll Report scheduled for release on Friday, August 4th.

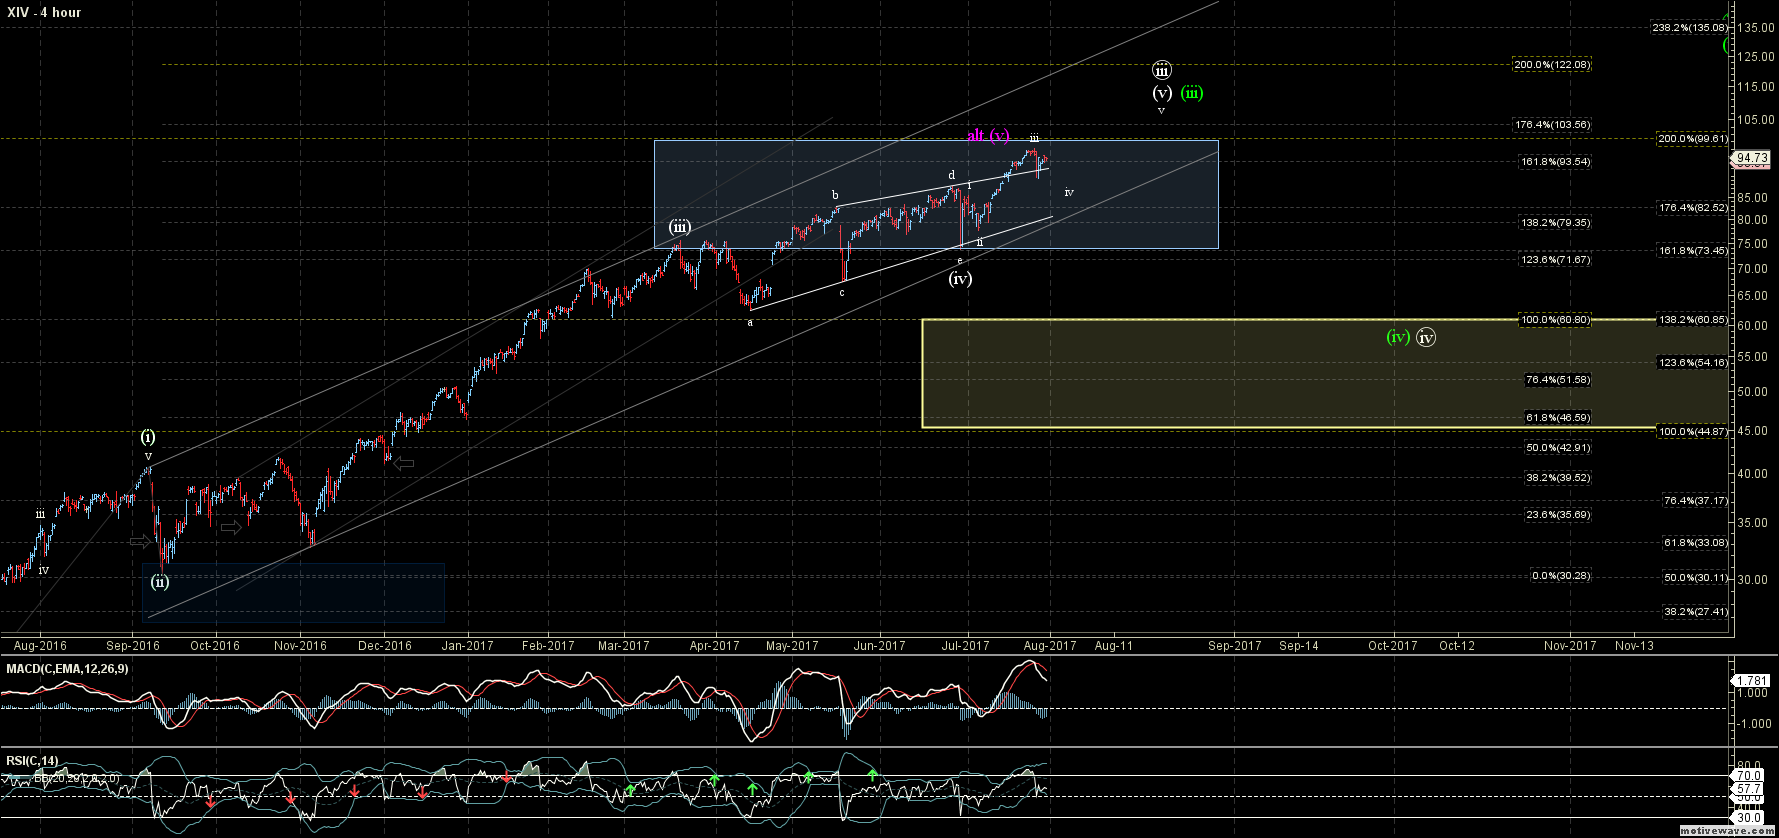
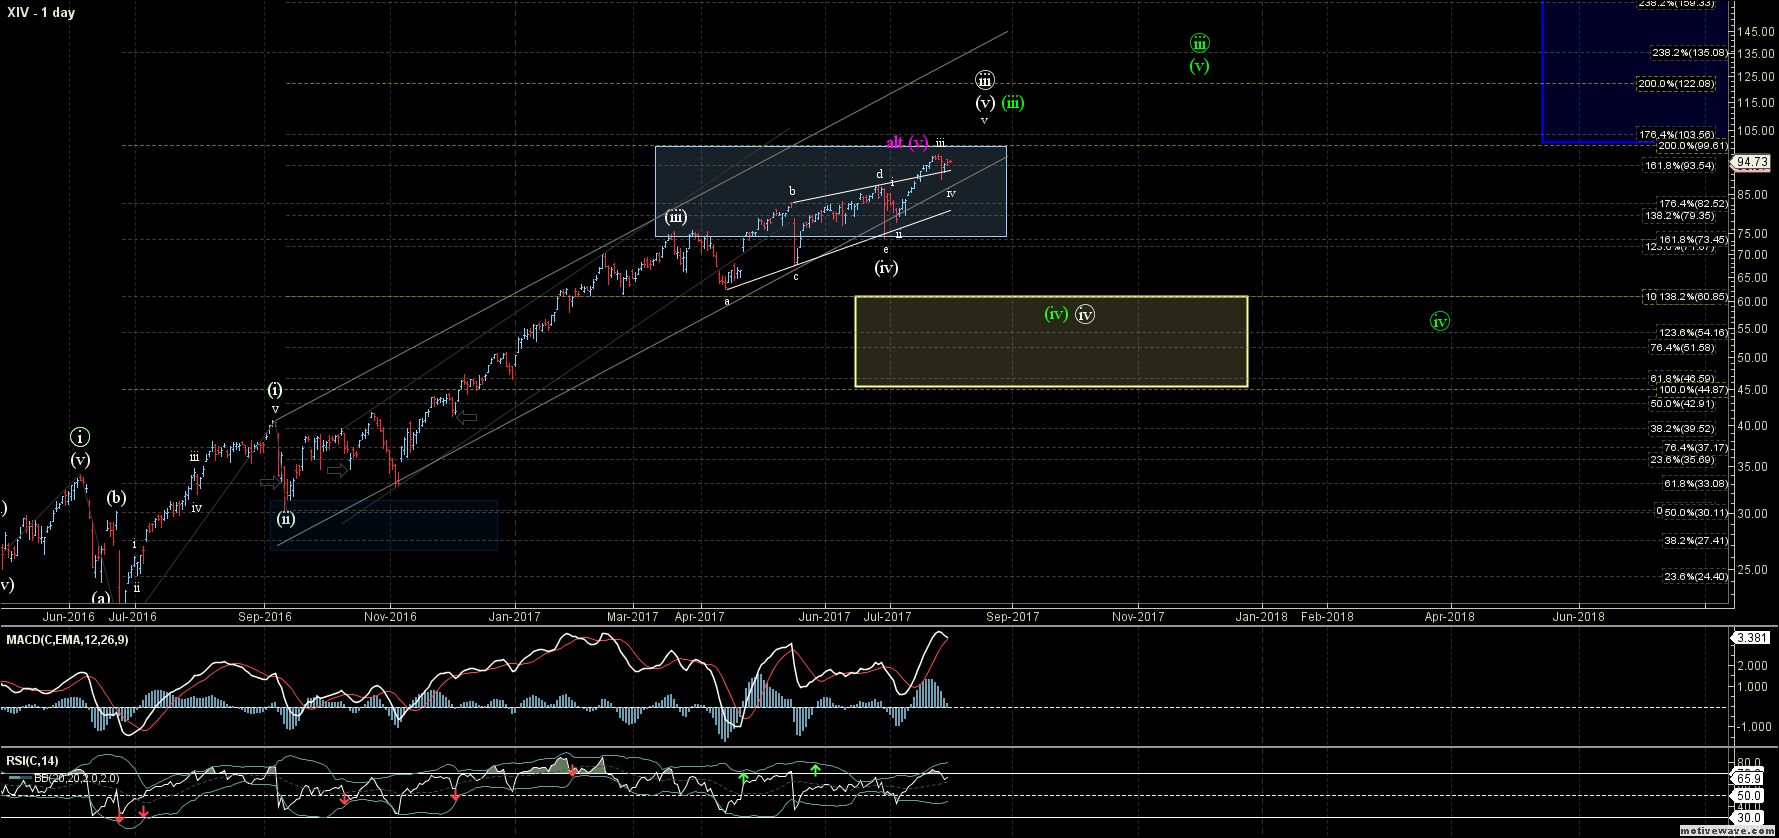
While the action on the smaller degree time scale is still somewhat sloppy I am still looking for a fairly deep retrace on the XIV on the larger time frames. It is really just a matter of whether we will see another high prior to that larger degree top occurring or if the XIV is ready to let go from current levels.
There are several price levels that should be key in helping give us a better idea if the XIV will be able to continue to hold on or if it is indeed ready to drop from current levels.

I have been discussing the ultra-low levels that we have been seeing in the VIX for the past several weeks. Last week I noted that the VIX broke its ten-day streak of closing under the 10 level by closing at 10.11 on July 27th. This was truly a historic streak as the previous streak was only two consecutive trading sessions.
So while the VIX did break this streak of closing under 10 the VIX was still trading under 11 on July 27th. This streak has continued into this week as the VIX closed at 10.44 on Thursday, August 3rd. This left the VIX with now 18 consecutive trading sessions closing under the 11 level breaking yet another record of for the VIX. Furthermore, the VIX has now closed under the 11 level at least in every single month of this year, something that it has never even come close to doing before.

On Thursday, August 8th the VIX did start to show some signs of life as it pushed up higher into the close spiking up to 10.44. The question moving forward is whether this spike will be able to sustain itself or if it will once again get smashed down as we have seen all year.
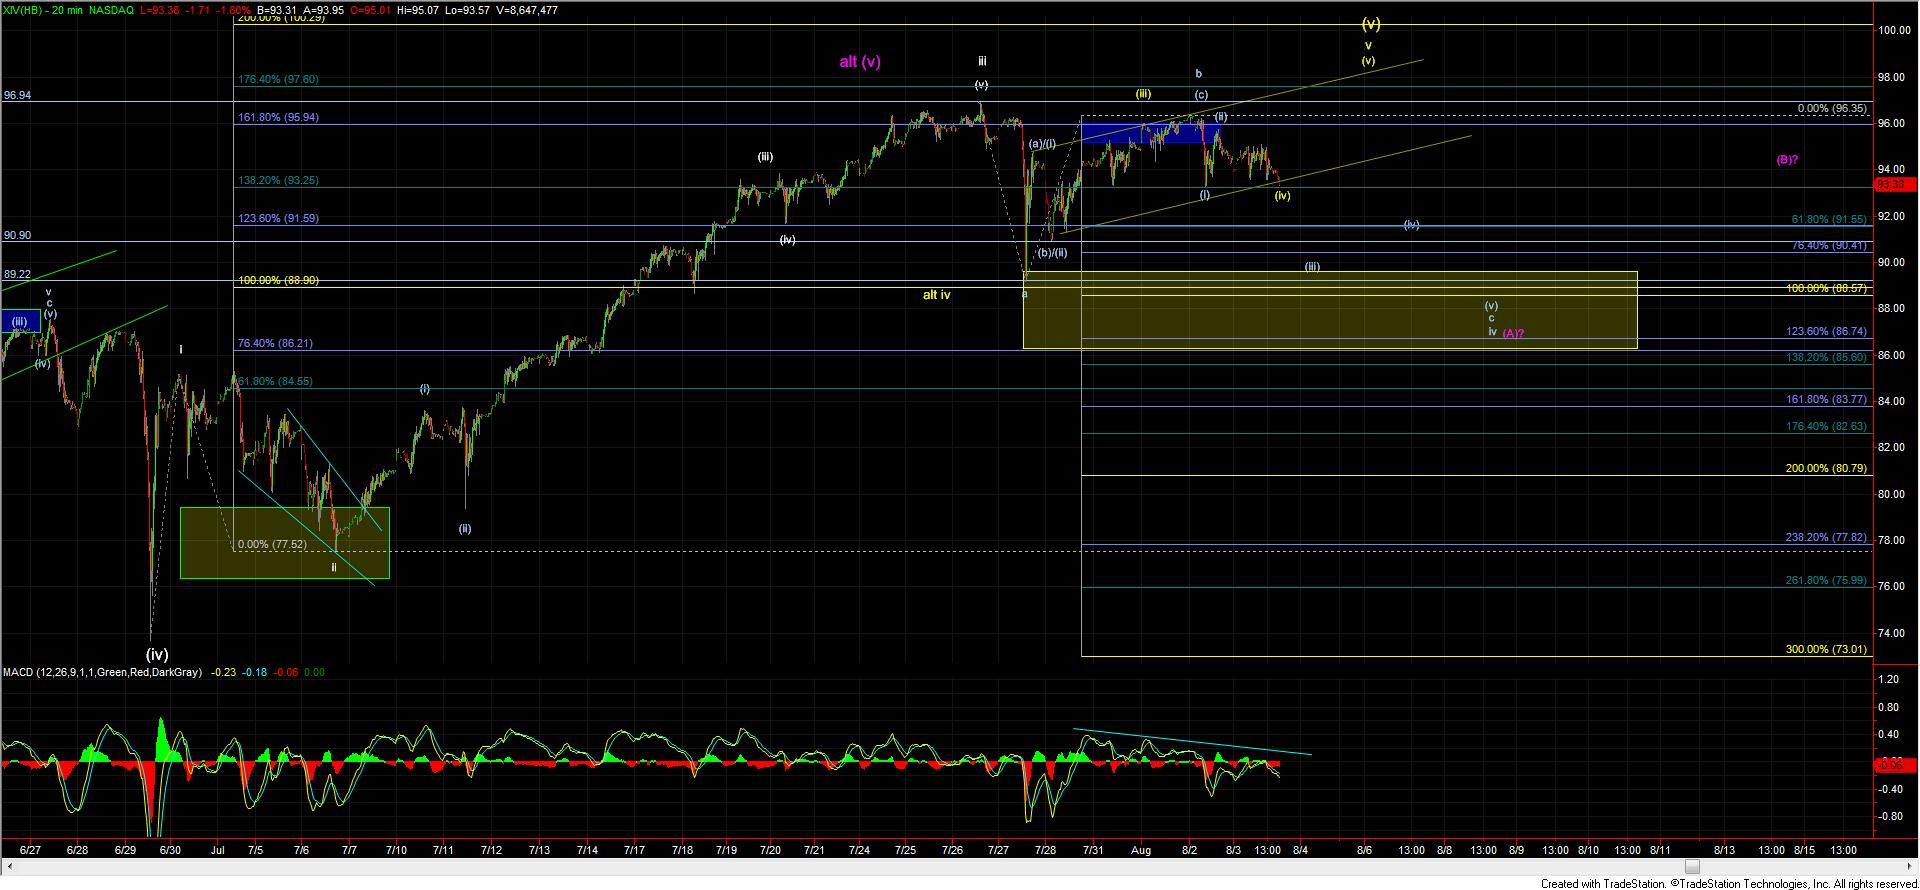
As I noted last week, although the move down on July 27th managed to hold over the upper end of the yellow support box which now sits at the 88.90-86.21 zone, that move down also counted best as a corrective wave structure. A corrective wave structure and holding over the shorter term support levels left the door open for the XIV to still see yet one more high over the 96.98 level prior to topping.
The action up off of the 89.22 low has been quite sloppy and overlapping in nature back to the upside. This type of action tells us that the move up off of that low is either corrective in nature or alternatively is forming an Ending Diagonal to finish off the pattern off of the June lows.
If the move is indeed corrective in nature, then it would portend another move lower under that 89.22 low prior to bottoming. Whereas if the move is indeed forming an Ending Diagonal it would suggest that the XIV will see yet another high directly from here prior to topping. In either of these two scenarios until the XIV breaks back under the 86.21 level we still do not have confirmation that a larger degree top has been made.
In either of these two scenarios, until the XIV breaks back under the 86.21 level we still do not have confirmation that a larger degree top has been made.
Once we do have confirmation of a top on the XIV, I am still expecting to see a fairly deep retrace down towards the 60.85-44.85 zone prior to bottoming and moving higher into 2018.
The XIV remains cracked but still not yet broken. While it may not take much to push the XIV off of the edge there are still several support levels not far below. While I am not nibbling on trades given this initial crack I still remain patient until we see those support levels break.
