
It has been about a month since the last earnings report for Xcel Energy Inc. (NYSE:XEL) . Shares have added about 4.8% in that time frame, outperforming the market.
Will the recent positive trend continue leading up to the stock's next earnings release, or is it due for a pullback? Before we dive into how investors and analysts have reacted as of late, let's take a quick look at the most recent earnings report in order to get a better handle on the important catalysts.
Xcel Energy Misses on Q1 Earnings, Keeps 2017 View
Minneapolis-based Xcel Energy recorded first-quarter 2017 operating earnings of $0.47 per share, lagging the Zacks Consensus Estimate of $0.50 by 6%. The earnings were in line with the year-ago quarter.
Despite the impact of unfavorable warmer winter temperatures, the company was able to match the year-ago results due to higher electric and natural gas margins and a lower effective tax rate.
Total Revenue
Xcel Energy’s first-quarter revenues of $2,946.4 million surpassed the Zacks Consensus Estimate of $2,908 million by 1.32% and the prior-year quarter level of $2,772.3 million by 6.3%.
Segment Results
Electric: Segment revenues increased from $2,185.2 million to $2,299.1 million in the reported quarter.
Natural Gas: Quarterly revenues grew 10.6% to $625.7 million.
Other: The segment recorded revenues of $21.6 million in the quarter, up 0.9%.
Quarterly Highlights
Total operating expenses increased 7.8% year over year to $2,460.2 million. Costs increased primarily due to higher electric fuel and purchased power.
Operating income in the reported quarter was down 0.8% year over year to $486.3 million.
Financial Highlights
Total debt as of Mar 31, 2017 was $15 billion, out of which long-term debt comprised $13.7 billion.
Looking Ahead
Xcel Energy has reiterated its 2017 operating earnings guidance in the range of $2.25–$2.35 per share.
The company projects a long-term annual earnings growth rate of 4–6%.
How Have Estimates Been Moving Since Then?
Analysts were quiet during the last one month period as none of them issued any earnings estimate revisions.
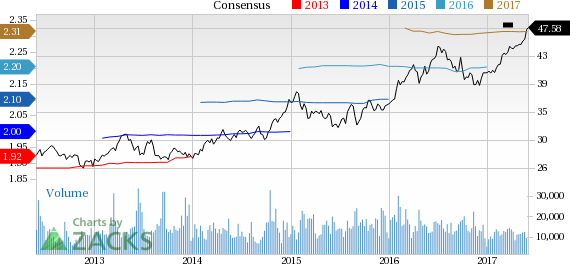
Xcel Energy Inc. Price and Consensus
VGM Scores
At this time, Xcel Energy's stock has a score of 'B' on both growth and momentum front. However, the stock was allocated a grade of 'C' on the value side, putting it in the middle 20% for this investment strategy.
Overall, the stock has an aggregate VGM Score of 'B'. If you aren't focused on one strategy, this score is the one you should be interested in.
Based on our scores, the stock is primarily suitable for growth and momentum investors.
Outlook
The stock has a Zacks Rank #4 (Sell). We expect a below average return from the stock in the next few months.
Xcel Energy Inc. (XEL): Free Stock Analysis Report
Original post
Zacks Investment Research