
XAG/USD, D1
On D1 chart the instrument is trading in a narrow range of 16.93-17.00. The Bollinger Bands are directed upwards, while the price range has widened which is a reason for the preservation of the upward trend. The nearest strong support level is 17.00, and breaking through it will be a signal for the opening of long positions. MACD histogram is in the positive zone, keeping a strong buy signal. Stochastic entered the oversold area, and there is no signal for entering the market.
XAG/USD, H4
On the H4 chart, the instrument corrected to the middle line of the Bollinger Bands. As in the D1 chart, the key resistance is the level of 17.00. The indicator has reversed downwards, and the price range has widened indicating the continuation of the current trend. MACD histogram is in the neutral zone with its volumes slightly reducing and forming a weak sell signal. Stochastic is approaching the oversold zone from above and does not give a clear signal for opening positions.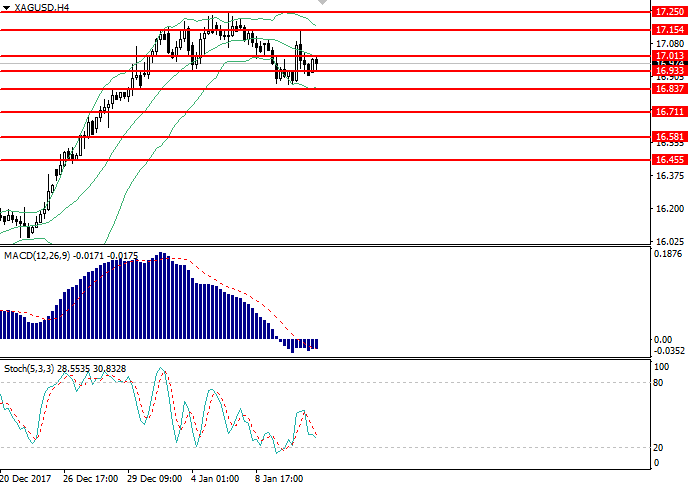
Key levels
Support levels: 16.45, 16.60, 16.71, 16.95, 16.68.
Resistance levels: 17.00, 17.15, 17.25, 17.35, 17.48.
Trading tips
Long positions may be opened above the level of 17.00 with the target at 17.45 and stop-loss at 16.85. Implementation time: 1-3 days.
Short positions may be opened from the level of 16.85 with the target at 16.50 and stop-loss at 17.03. Implementation time: 2-4 days.
- English (UK)
- English (India)
- English (Canada)
- English (Australia)
- English (South Africa)
- English (Philippines)
- English (Nigeria)
- Deutsch
- Español (España)
- Español (México)
- Français
- Italiano
- Nederlands
- Português (Portugal)
- Polski
- Português (Brasil)
- Русский
- Türkçe
- العربية
- Ελληνικά
- Svenska
- Suomi
- עברית
- 日本語
- 한국어
- 简体中文
- 繁體中文
- Bahasa Indonesia
- Bahasa Melayu
- ไทย
- Tiếng Việt
- हिंदी
XAG/USD: January 11 Technical Analysis
ByMayzus
Published 01/11/2018, 07:20 AM
Updated 03/09/2019, 08:30 AM
XAG/USD: January 11 Technical Analysis
Latest comments
Install Our App
Risk Disclosure: Trading in financial instruments and/or cryptocurrencies involves high risks including the risk of losing some, or all, of your investment amount, and may not be suitable for all investors. Prices of cryptocurrencies are extremely volatile and may be affected by external factors such as financial, regulatory or political events. Trading on margin increases the financial risks.
Before deciding to trade in financial instrument or cryptocurrencies you should be fully informed of the risks and costs associated with trading the financial markets, carefully consider your investment objectives, level of experience, and risk appetite, and seek professional advice where needed.
Fusion Media would like to remind you that the data contained in this website is not necessarily real-time nor accurate. The data and prices on the website are not necessarily provided by any market or exchange, but may be provided by market makers, and so prices may not be accurate and may differ from the actual price at any given market, meaning prices are indicative and not appropriate for trading purposes. Fusion Media and any provider of the data contained in this website will not accept liability for any loss or damage as a result of your trading, or your reliance on the information contained within this website.
It is prohibited to use, store, reproduce, display, modify, transmit or distribute the data contained in this website without the explicit prior written permission of Fusion Media and/or the data provider. All intellectual property rights are reserved by the providers and/or the exchange providing the data contained in this website.
Fusion Media may be compensated by the advertisers that appear on the website, based on your interaction with the advertisements or advertisers.
© 2007-2024 - Fusion Media Limited. All Rights Reserved.