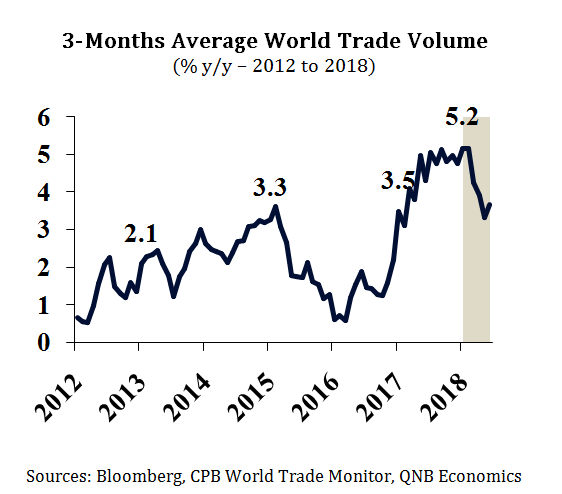
After more than four years in the doldrums, world trade volumes have rebounded strongly over the last two years. In fact, according to data from the Dutch Bureau for Economic Policy Analysis (CPB), a leading agency in the monitoring of world trade, the3-months average y/y growth in world trade volumes jumped from 2.1% over April 2012-April 2016 to 5.2% in January2018; followed by a slow down to 3.7% in June.
There are two main reasons for the recovery. Firstly, IMF data shows that global growth had strengthened from an average of 3.5% y/y in 2012-2016 to 3.8% in 2017 with a degree of synchronization not seen since 2010.
In 2017, the Euro Area and Japan had accelerated to 2.3% and 1.7% from sluggish growth rates of 0.8% and 1.2%, between2012 and 2016. The US economy regained momentum to grow 2.3% after its industrial sector endured a shallow recession in 2015-2016 while emerging markets (EM) were able to grow faster at 4.8%. China managed to control capital outflows and avoid a deeper deceleration or new bouts of disorderly devaluation.
Secondly,commodity prices have also rebounded after the 2014-2016 weakness. According to the World Bank, both energy and non-energy commodities slumped by 69% and 25%, respectively, from June 2014 to their through in January 2016. Subsequently, they grew by 123% and 12% in the 32 months to August 2018; this is key to world trade volumes as commodities are one of the largest and most volatile portions of tradable goods.
However, recently, important cyclical indicators and gauges for trade momentum are starting to weaken; 3-months average y/y growth in world trade volumes have slowed by 150bp from January to June 2018. This slowdown is corroborated by cargo volume at major ports.On a similar note, surveys such as the global manufacturing Purchasing Managers’ Index (PMI) exhibit that new export orders peaked in early 2018 and have now fallen.
3-Months Average World Trade Volume (% y/y – 2012 to 2018)

Sources: Bloomberg, CPB World Trade Monitor, QNB Economics
Slower world trade is somewhat surprising as commodity prices remain firm and consensus forecasts indicate that the world is on course to see a robust 3.7% growth in 2018, its best performance since 2011. Importantly, the US economy is running at full speed.Q2 GDP growth boomed at 4.2% annualized pace and monthly indicators suggest a similar pace will be sustained in Q3. The private sector’s optimism in particular seems sky high with key surveys such as the Institute for Supply Management (ISM)and small business confidence close to, or reaching, all-time highs over the last month.
Although heightened trade frictions may lead to new tariffs impacting trade volumes in the future, their share of world trade is marginal. According to Capital Economics, only around 1%of world trade have been affected by new tariffs so far and bilateral trade between the US and China accounts for just 3.2% of world exports.
Slower growth in non-US advanced economies and China appears to be the culprit for weaker trade. Consensus forecasts for the Euro Area and Japan in 2018 slipped from 2.4% to 2.1% and from 1.4% to 1%, respectively since April. Similarly, EM growth consensus forecasts in 2018 declined by 24bps.
China’s growth, particularly, has cooled as regulatory financial tightening targets shadow banks and slows credit growth. Latest activity data shows that retail sales and fixed asset investment growth registered their slowest growth in over a decade in the last few months.
Looking ahead, a further slowdown in world trade is likely. On the downside, activity in the Euro Area and Japan is expected to soften with consensus forecast at 1.8% and 1% growth in 2019, respectively.
In the US, monetary tightening should ensure that growth slows to around 2.5%next year well above GDP’s likely c.2% potential rate. In response, the Federal Reserve may be forced to step up the pace of policy tightening. Consequently,EM central banks may be forced to hike their policy rates to limit capital outflows and FX pressures, constraining growth. Finally, the US-China trade tensions are at a clear risk of escalating further.
On the upside, China is expected to maintain 6+% growth as both fiscal and monetary policies are eased and authorities prioritize expansion over financial deleveraging. Despite headwinds associated with tighter USD liquidity and a stronger USD, EMs in aggregate are also resilient and expected to grow by 5% in 2019.
In brief, world trade has been a fair reflection of overall global growth, a phenomenon that is currently changing given the recent slip following softening non-US activity. However, the world economy is expected to grow at a healthy 3.6% in 2019; in the absence of major shocks, this should ultimately support a relatively high – yet somewhat slower – world trade growth.
