
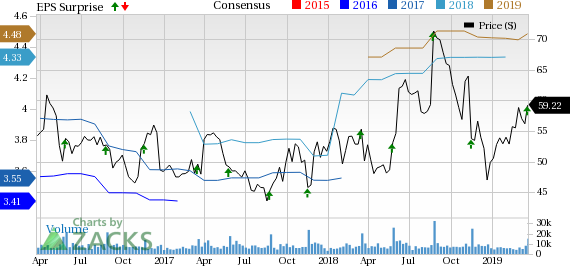
Williams-Sonoma Inc.’s (NYSE:WSM) shares climbed 4.2% to $59.22 on Mar 21, after reporting fourth-quarter fiscal 2018. Earnings and revenues beat the Zacks Consensus Estimate by 6.6% and 2.2%, respectively, in the quarter.
Non-GAAP earnings of $2.10 per share (at the high end of the guided range) surpassed the Zacks Consensus Estimate of $1.97. The figure grew 25% year over year.
Revenues of $1,836.4 million beat the consensus mark of $1,797.4 million and grew 9.3% year over year.
Williams-Sonoma, Inc. Price, Consensus and EPS Surprise
Comps increased 2.4% in the fourth quarter, compared with 5.4% in the year-ago quarter.
The company’s West Elm brand’s comps grew 11.1% compared with 12.3% growth in the prior-year quarter. Also, the company’s Williams (NYSE:WMB) Sonoma brand’s comps grew 0.1% from 4.3% registered in the prior-year quarter. Pottery Barn Kids and Teen’s comps grew 1.6% compared with 1.4% growth in the year-ago quarter. However, Pottery Barn’s comps were down 0.4% against 4.1% growth in the year-ago quarter.
Segment Details
E-Commerce (54.6% of fiscal fourth-quarter revenues) segment reported net revenues of $1,002.2 million in the quarter, up 14.3% year over year.
Retail (45.4%) segment’s net revenues inched up 3.9% to $834.2 million.
Operating Highlights
Non-GAAP gross margin was 38.7%, up 20 basis points (bps) from fourth-quarter fiscal 2017. The upside can be attributed to occupancy leverage, partially offset by lower selling margins.
Non-GAAP selling, general and administrative (SG&A) expenses were 26.9% of net revenues compared with 26.1% in the year-ago quarter, reflecting an increase of 80 bps due to new revenue recognition standards which were partially offset by advertising leverage.
Non-GAAP operating margin was 11.9% in the quarter, down 50 bps year over year.
Merchandise inventories increased 6% to $1.1 billion.
Financials
Williams-Sonoma reported cash and cash equivalents of $339 million as on Feb 3, 2019, compared with $390.1 million as on Jan 28, 2018.
During the fiscal fourth quarter, the company increased its existing stock repurchase program by $500 million. Presently, Williams-Sonoma has $210 million remaining under its present stock repurchase program.
Dividend Hike
Williams-Sonoma announced an 11.6 % increase in its quarterly cash dividend to 48 cents per share. The quarterly dividend is payable on May 31, 2019, to stockholders of record as of the close of business on Apr 26, 2019.
Fiscal 2018 Highlights
The company’s earnings came in at $4.46 per share, on a non-GAAP basis, reflecting an increase of 23.5% from fiscal 2017 profit level. Net revenues were $5.67 billion, up 7.2% from the year-ago level. On a non-GAAP basis, net revenues grew 7.1%.
Comps grew 50 bps over last year to 3.7% with positive comps growth in all brands, including 150-bp growth in the Pottery Barn brands.
Fiscal 2019 Guidance
Williams-Sonoma expects non-GAAP earnings per share in the band of $4.50-$4.70.
Net revenues are projected in the range of $5.670-$5.840 billion. Comps are likely to grow 2-5%. Non-GAAP operating margin is expected to be in line with fiscal 2018 levels.
The company expects an incremental buyback of shares under a repurchase authorization of approximately $710 million.
The company expects to close 30 stores in the year, bringing down the total store count to 595 by the end of the year.
Zacks Rank & Key Picks
Currently, Williams-Sonoma carries a Zacks Rank #3 (Hold).
A few better-ranked stocks in the Retail-Wholesale sector are Restoration Hardware Holdings Inc. (NYSE:RH) , PC Connection, Inc. (NASDAQ:CNXN) and Tech Data Corporation (NASDAQ:TECD) .
While Restoration Hardware sports a Zacks Rank #1 (Strong Buy), PC Connection and Tech Data carry a Zacks Rank #2 (Buy). You can see the complete list of today’s Zacks #1 Rank stocks here.
RH has an expected long-term earnings growth rate of 17.5%.
PC Connection’s expected long-term earnings growth rate is 8%.
Tech Data has an impressive earnings surprise history, beating the Zacks Consensus Estimate in three of the trailing four quarters, the average beat being 16.8%.
Breakout Biotech Stocks with Triple-Digit Profit Potential
The biotech sector is projected to surge beyond $775 billion by 2024 as scientists develop treatments for thousands of diseases. They’re also finding ways to edit the human genome to literally erase our vulnerability to these diseases.
Zacks has just released Century of Biology: 7 Biotech Stocks to Buy Right Now to help investors profit from 7 stocks poised for outperformance. Our recent biotech recommendations have produced gains of +98%, +119% and +164% in as little as 1 month. The stocks in this report could perform even better.
See these 7 breakthrough stocks now>>
Restoration Hardware Holdings Inc. (RH): Free Stock Analysis Report
Williams-Sonoma, Inc. (WSM): Free Stock Analysis Report
Tech Data Corporation (TECD): Free Stock Analysis Report
PC Connection, Inc. (CNXN): Free Stock Analysis Report
Original post