The trading week begins with a spike in uncertainty following last week’s U.S. airstrike that killed Qassem Soleimani, Iran’s top military official. Although most of the major asset classes posted gains last week and still reflect across-the-board profits for the one-year trend, repricing risk has become substantially more challenging – and critical.
Processing the blowback risk will take time, in part because there are multiple fronts to consider. From a strategic perspective, for instance, there are questions of how the U.S. Middle East strategy fares. It’s fair to say that there are many more questions about how the Trump administration moves forward.
Last week’s airstrike “unquestionably made an already volatile situation much more dangerous,” warns retired Army Lieutenant Colonel Daniel Davis, a senior fellow at Defense Priorities.
“If you paid any attention to Iran in the last 40 years you know they will never buckle to that kind of pressure. It’s just the opposite.”
Reflecting the sudden shift in geopolitical assessments, stock markets have turned to a risk-off bias while oil and gold are among the beneficiaries. “The threat is that lingering uncertainty about future conflict will add a security premium to the price of oil,” predicts Michael Lynch, president of Strategic Energy & Economic Research.
Greg Valliere, chief U.S. policy strategist at AGF Investments says the Trump administration’s decision to take out Soleimani is a “game changer that will obscure everything else.”
Perhaps, although no one really knows what the extent of any blowback will be at this point and so the case for extreme portfolio shifts at this point is premature. On that note, let’s review where the major asset classes stand through the close of trading on Friday (Jan. 3), based on a set of ETFs.
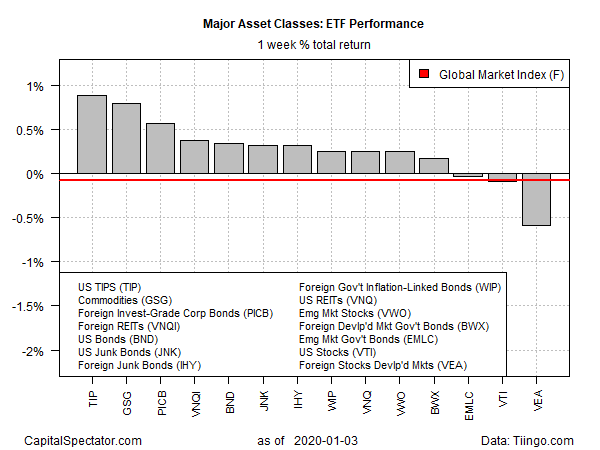
Last week’s top performer: inflation-indexed Treasuries via iShares TIPS Bond (NYSE:TIP). The fund jumped 0.9%, rising to a record high.
Commodities also rose, driven by crude oil as the market priced in the potential for supply shortages if Middle East exports are curtailed in an escalating U.S.-Iran conflict. The iShares S&P GSCI Commodity-Indexed Trust (NYSE:GSG) was the second-best performer last week, gaining 0.8% and pushing the fund up to its highest close since last April.
The biggest loss in last week’s trading: foreign stocks in developed markets. Vanguard FTSE Developed Markets (NYSE:VEA) slumped 0.6%.
Risk-off sentiment took a bite out of the Global Market Index (GMI.F) last week. This unmanaged benchmark that holds all the major asset classes (except cash) in market-value weights fell 0.7%–the first weekly setback for the index since late-November.

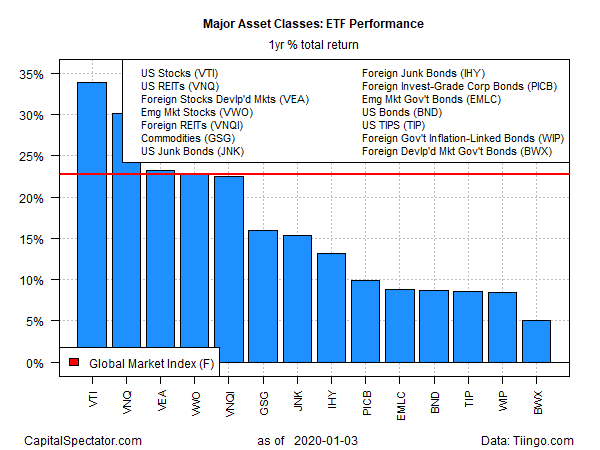
For the one-year trend, US stocks are still the top performer. Vanguard Total Stock Market (NYSE:VTI) is up an impressive 33.9% on a total return basis over the past 12 months.
The weakest performer among the major asset classes for the trailing one-year window: SPDR Bloomberg Barclays International Treasury Bond (NYSE:BWX), which is ahead by a relatively mild 5.0%.
GMI.F, on the other hand, is flying high for the one-year change, posting a strong 22.7% total return as of Friday’s close.

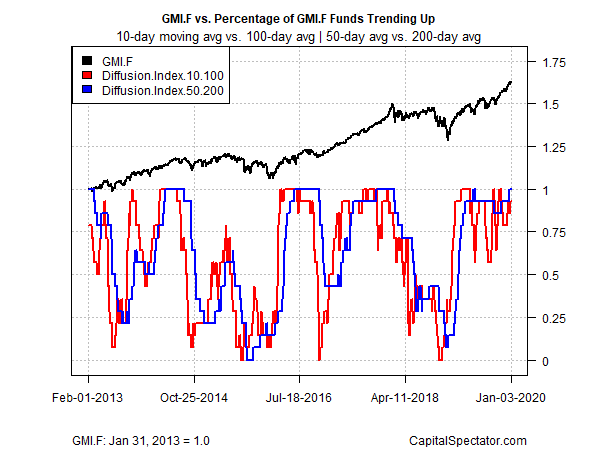
Reviewing all the ETFs listed above through a momentum lens still shows that a strong upside bias persists. It remains to be seen how or if the bullish profile changes in the days ahead as global markets reprice risk in the wake of the US military action. As of Friday’s close, however, the trend looks strong. The analysis is based on two sets of moving averages. The first compares the 10-day moving average with its 100-day counterpart — a proxy for short-term trending behavior (red line in chart below). A second set of moving averages (50 and 200 days) represent the intermediate measure of the trend (blue line).

