Get 40% Off
👀 👁 🧿 All eyes on Biogen, up +4,56% after posting earnings. Our AI picked it in March 2024.
Which stocks will surge next?
Unlock AI-picked Stocks

Will Silver Shine In 2020?

Published 12/24/2019, 01:56 AM
Updated 07/09/2023, 06:31 AM
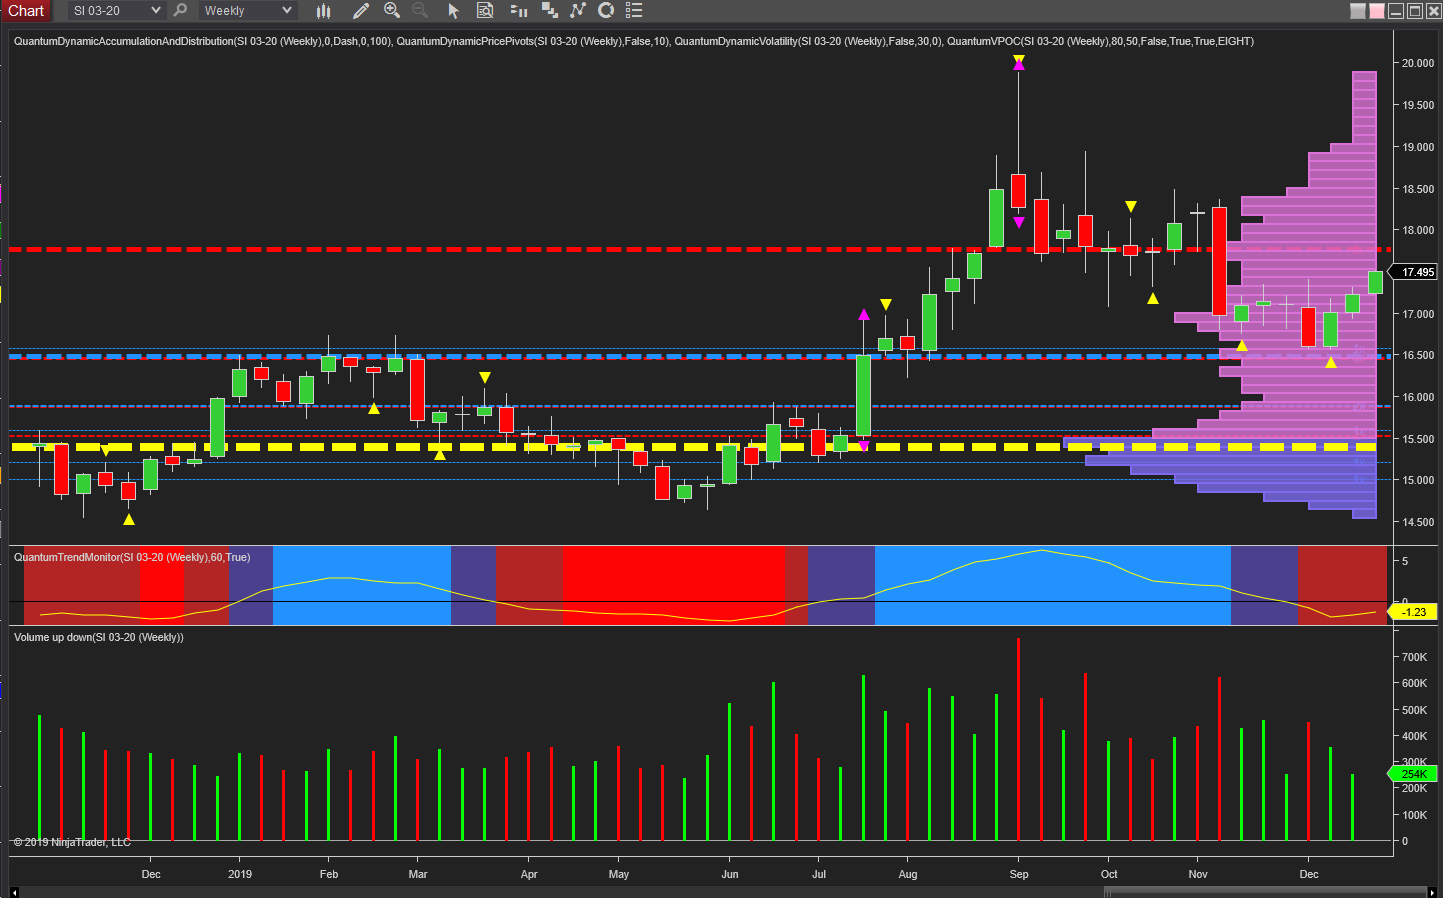
Silver Weekly Chart

Let’s now turn our attention to the precious metals, and rather than consider gold, move to silver which has had a roller coaster year, but is managing to close the year higher. The defining price action here was executed in the summer months, with the industrial metal climbing fast over several weeks only for the price action in early September to bring the move to a shuddering halt with a cluster of signals of weakness combining at this point.

First we had the candle itself with a deep wick to the upper body and on its own, signaling strong selling and therefore weakness ahead. This was confirmed by associated volume which was the highest of the year by some distance and so reinforcing the strength of selling during this week. The volatility indicator was also triggered in this timeframe – an unusual occurrence on a slower timeframe chart and signalling congestion or a reversal as a result.

The indicator considers average true range and is triggered when price action moves outside this range. And finally we had a pivot high (yellow triangle) posted on this candle adding further to the expected weakness which duly arrived driving the metal lower, before the minor rally we are currently witnessing in December. So, where next for silver, and by extension gold?

For silver, and from a technical perspective, there are two key levels. One above and one below the current price of $17.47 per ounce. Below at $16.50 per ounce, we have a cluster of two support levels, one blue and one red. Whilst individually they are relatively weak, together as a cluster they offer a strong platform of support and one which already came into play in late November and early December with the two bar reversal.

3rd party Ad. Not an offer or recommendation by Investing.com. See disclosure here or remove ads .

An excellent springboard is therefore in place. However, above we have resistance ahead at $17.70 per ounce and denoted with the red dashed line of the accumulation and distribution indicator. Still, this is relatively light, and assuming we see good volume in the new year, coupled with a falling U.S. dollar, this may help to propel the metal higher, on towards $18.50 per ounce, with the potential to move to the highs of this year of $19.89 per ounce given the light volume awaiting on the volume point of control histogram.

Latest comments

Risk Disclosure: Trading in financial instruments and/or cryptocurrencies involves high risks including the risk of losing some, or all, of your investment amount, and may not be suitable for all investors. Prices of cryptocurrencies are extremely volatile and may be affected by external factors such as financial, regulatory or political events. Trading on margin increases the financial risks.
Before deciding to trade in financial instrument or cryptocurrencies you should be fully informed of the risks and costs associated with trading the financial markets, carefully consider your investment objectives, level of experience, and risk appetite, and seek professional advice where needed.
Fusion Media would like to remind you that the data contained in this website is not necessarily real-time nor accurate. The data and prices on the website are not necessarily provided by any market or exchange, but may be provided by market makers, and so prices may not be accurate and may differ from the actual price at any given market, meaning prices are indicative and not appropriate for trading purposes. Fusion Media and any provider of the data contained in this website will not accept liability for any loss or damage as a result of your trading, or your reliance on the information contained within this website.
It is prohibited to use, store, reproduce, display, modify, transmit or distribute the data contained in this website without the explicit prior written permission of Fusion Media and/or the data provider. All intellectual property rights are reserved by the providers and/or the exchange providing the data contained in this website.
Fusion Media may be compensated by the advertisers that appear on the website, based on your interaction with the advertisements or advertisers.
© 2007-2024 - Fusion Media Limited. All Rights Reserved.