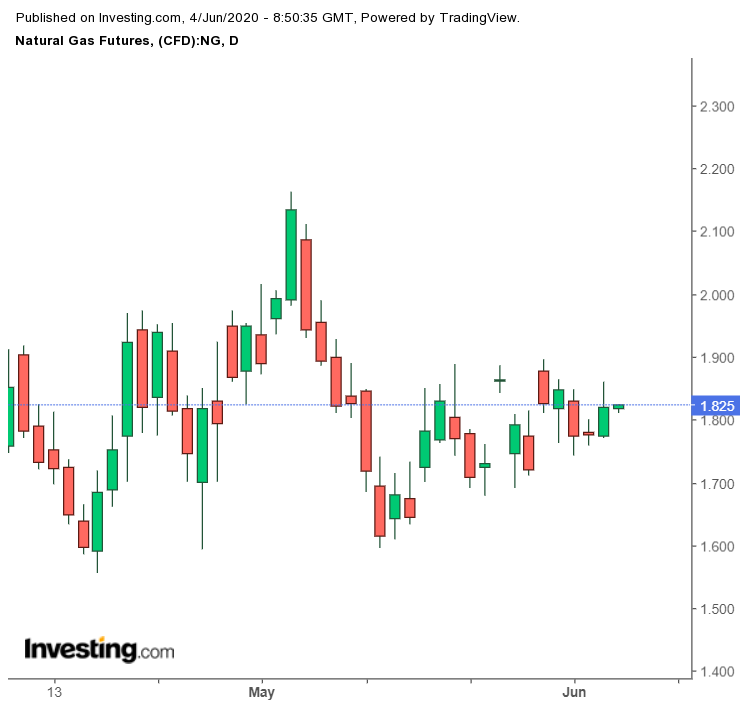
After a dismal May for natural gas, power burns from an America reopening from coronavirus lockdowns, as well as higher temperatures that require more use of air-conditioning, are giving a glimmer of hope to the longs out there. But moderating weather forecasts by mid-June could again restrain gas consumption, renewing the challenges for market bulls.
Another problem is the continued erosion in liquefied natural gas exports and utilization rates for LNG facilities in the United States, as the Atlantic storm season begins. Less than 5% of U.S. natural gas has been produced in the Gulf of Mexico since 2015 due to the shale boom, meaning even the most devastating hurricane in the area might only have a limited impact on gas output capacity. Yet, in a market already nerve-wracked by LNG shipment disruptions—estimated at just 65 cargoes since March—any further outages caused by storms could heavily affect prices.
Even with the COVID-19 pandemic and unprecedented LNG feed-gas volatility, summer weather still plays a “critical” role in balancing the market, naturalgasintel.com said in a Wednesday report, citing analysis by the Washington-based consultancy EBW AnalyticsGroup.
More Cooling Degree Days Ahead
The first three weeks of June are forecast to register 44 cooling degree days (CDDs), EBW data shows. CDDs measure the number of degrees a day's average temperature is above 65 Fahrenheit (18 Celsius) and are used to estimate demand to cool homes and businesses. That reading is integral to the power-burns forecast in the weeks ahead as U.S. states attempt to fully reopen from shutdowns that began in March.
EBW also anticipates gas demand at 57 billion cubic feet (bcf) above-normal levels through the week ended June 21.
That demand projection comes ahead of the U.S. Energy Information Administration’s weekly data release at 10:30 AM ET (14:30 GMT) that is likely to show an injection of 110 bcf into storage for the week ended May 29, according to a consensus of analysts tracked by Investing.com.
If accurate, the build would be almost unchanged from the previous week’s injection of 109 bcf into storage.
It would also be lower than the 118-bcf increase in storage during the same week a year ago, but higher than the five-year (2015-2019) average build of 103 bcf for the period.
However, a 110-bcf increase for the week ended May 29 would boost national stockpiles of gas to 2.722 trillion cubic feet. That would be 18.8% higher than the five-year average and about 39.4% above the same week a year ago.
Inventory Builds Stay In 3-Digits, But Stabilizing
Signs that inventory builds were stabilizing—despite remaining above three-digits in recent weeks— helped Henry Hub’s front-month July contract for gas on NYMEX rebound 2.5% over the past three sessions to $1.82 per million metric British thermal units (mmBtu) ahead of Thursday’s EIA data. That offset Monday’s 4% drop, limiting the contract’s loss for the week.
Henry Hub’s successive summer months, August and September, both settled below the key $2 per mmBtu handle. The October 2020 contract, through the rest of the gas futures strip, remained under the $3 mark.
But Goldman Sachs, Wall Street’s leading voice in energy trading, maintained its higher summer outlook for gas pricing due to losses in associated output from the COVID-19-enforced shut-in of oil wells that also produce natural gas.
Goldman Sees $3 Summer NatGas Pricing
“While our revised Sum20 NYMEX gas price forecast underscores how well supplied the current summer is, as we move into winter we maintain our view that US gas prices still need to rally significantly from current levels in order to incentivize lower demand and higher supply in the face of expected declines in associated gas production,” Goldman said in a research note shared with the media on Thursday.
“As a result, we maintain our 2020/21 winter and 2021 summer NYMEX gas price forecasts at $3.50/mmBtu and $3.25/mmBtu, respectively."
EBW concurs, saying that while swelling storage, weak LNG demand and a projected increase in associated gas production may carry the forward curve lower through the middle of summer, a rebound may begin to take shape. This could occur as the year/year storage surplus shrinks, and production resumes its decline.
Furthermore, the second half of summer may be hotter than the first half, if current forecasts materialize, and it is possible the economic rebound may gather strength, EBW said. Even LNG may begin to load floating storage by late summer, though most analysts expect to see significant cargo cancellations through October.
“Although a plethora of moving pieces makes for a complex outlook -- and bearish relapses entirely possible -- if the most-likely storage trajectory appears as it does currently, a sharp rebound in NYMEX futures is possible this fall,” EBW said.
Genscape Sees 2020 High For Power Burns
Like Goldman’s higher demand expectations for summer gas, widely-followed energy consultancy Genscape also has a more robust outlook for power burns.
Daniel Spangler, data and analytics manager at Genscape, told naturalgasintel.com he expected more widespread heat to drive up power-generation demand in the near-term to levels more typical of early July.
Spangler pointed out that low spot prices were creating an incentive for natural gas to take a larger share of the power generation mix, when often coal is the cheapest fuel.
He said:
“Genscape’s gas burn for power estimate for Wednesday’s gas day is over 35 bcf per day, which would be a new high for the year."
* Disclaimer: Barani Krishnan does not own or hold a position in the commodities or securities he writes about.
