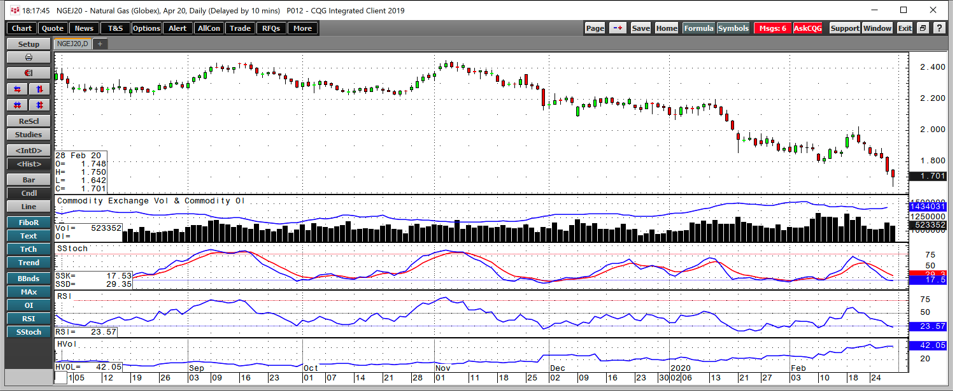
The natural gas futures market ended last week with another new low. While markets across all asset classes were panting from a week of wild volatility, natural gas quietly slipped below the $1.70 per MMBtu level after the March futures rolled to April. Natural gas can be one of the most volatile futures markets. Last week it established a streak of seven consecutive losses. Other markets plunged, including crude oil, and natural gas moved to its lowest price since 2016.
The spread of coronavirus to South Korea, Iran and Europe caused panic selling across most asset classes. At the same time, the success of U.S. Presidential candidate Senator Bernie Sanders, a self-proclaimed Democratic Socialist, increased the potential of significant policy changes in the United States. A Sanders presidency could create dramatic shifts in the landscape for taxes, energy and the overall direction of the U.S. economy and position in the world.
Markets reflect the economic and political landscapes. Meanwhile, the price action in natural gas reflects the upcoming end to the peak season for demand, so it was no surprise. The United States Natural Gas ETF product (NYSE:UNG) moves higher and lower with the price of the nearby natural gas futures contract. The UGAZ and DGAZ ETNs turbocharge the price action on the up and downside. The ETNs offer market participants a triple-leveraged return that magnifies the typically volatile futures arena.
If You Blinked, You Missed The Move Above $2
On February 20, the price of April natural gas futures moved above the $2 per MMBtu level for the first time since January 17. It remained above two bucks for about one hour.

(Source: CQG)
The daily chart shows the recovery that took the now active month contract from a low of $1.788 on February 11 to $2.024 per MMBtu on February 20. The rally caused price momentum and relative strength metrics to rise above neutral readings. Speculative shorts had been cashing in on the decline in the energy commodity since early November as the price dropped from just over $2.90 to a low of $2.753 per MMBtu. The total number of open long and short positions declined from 1.54 million on February 6 to a low of 1.405 million contracts on February 21. Those who took profits stood ready to take advantage of the rally.
Another Chance To Sell
The price action that took the price of natural gas from $1.753 to just over $2 allowed the speculative bears an opportunity to sell once again. As of February 21, inventory levels across the United States were 40.8% above last year’s level and 8.9% over the five-year average for this time of the year. The high level of stockpiles provided fundamental support for a short position as the price appreciated. Over the past week, selling in crude oil, the stock market and most assets were another reason to lean into the energy commodity. The daily chart shows that April futures fell to a low of $1.642 per MMBtu on the final trading session in February.
March began this week and that means that the end of the 2019/2020 peak season of demand is now only three weeks away. The shorts have their targets set on a level that was only 3.10 cents below last week’s low.
New Lows Are A Good Bet
In March 2016, the price of natural gas dropped to $1.611 per MMBtu, which was the lowest price since back in 1998. April futures settled at $1.684 on February 28.
The long-term quarterly chart dating back to 1990, when the energy commodity started trading on the NYMEX division of the CME, shows that the low in 2016 was only one tick or $0.001 above the 1998 bottom. Below there, natural gas hit a low of $1.25 in 1995 and $1.02 per MMBtu in 1992. The critical level of technical resistance now stands at the 2016 low. If the price falls below that level, there is no telling where the shorts could push the energy commodity.
After the recent price action, the one thing that is for sure is that natural gas can only decline by $1.648 per MMBtu before it reaches zero. Considering the price traded to highs of $15.65 in 2005, $13.694 in 2008, $6.493 in 2014 and $4.929 per MMBtu in late 2018, the energy commodity is a lot closer to a long-term technical bottom than a resistance area on the chart.
The recent selling came as no surprise in the natural gas market. Over the coming weeks, the shock could wind up being how low the futures contract falls before it finds a significant bottom.
The United States Natural Gas Fund was trading at $13.41 per share on Monday afternoon, up $0.31 (+2.37%). Year-to-date, UNG has declined -42.50%, versus a 13.29% rise in the benchmark S&P 500 index during the same period.
UNG currently has an ETF Daily News SMART Grade of C (Neutral), and is ranked #51 of 109 ETFs in the Commodity ETFs category.
