The September sell-off that has gripped stocks has begun showing encouraging signs of improvement. Here is our “no nonsense” technical analysis of the current market, as well as a few top stocks to put on your watchlist.
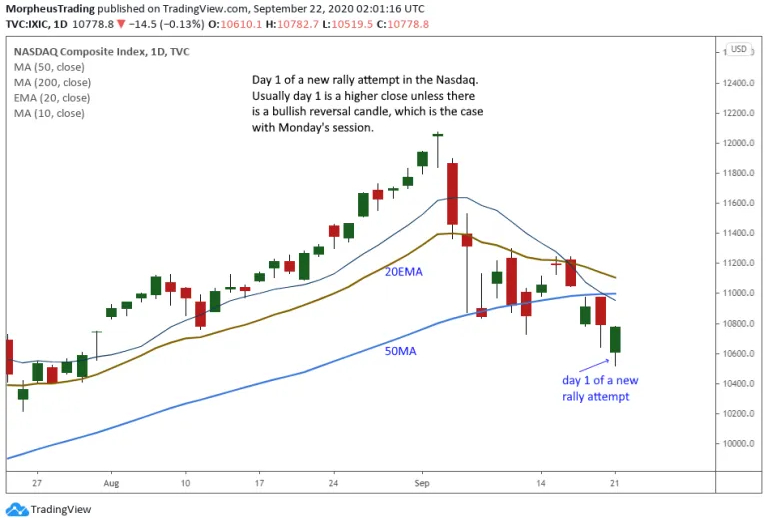
September 21's bullish reversal action on the daily chart of the NASDAQ Composite was an encouraging sign for bulls.
During a new rally attempt after a correction, we look for the price of the NASDAQ (and S&P 500) to hold above the low of Day 1 for at least three more days.
On Day 4 or later of a new rally, we then look for a bullish “follow-through day” to occur.
With our swing trading strategy, which is loosely based on CAN SLIM system, a follow-through day occurs when the NASDAQ gains at least 1.5%.
If a follow-through day forms on or after Day 4, then a new “buy” signal is generated in our market timing system.
Watch for emerging leadership stocks
More important than the chart patterns of market indexes is the performance of leading stocks.
Specifically, we look for confirmation through bullish price and volume action in leadership stocks.
When a market in correction mode starts recovering, it should be accompanied by emerging leadership in top growth stocks.
With the bullish action of September 21, leading stocks on our internal watchlist confirmed the strength in the NASDAQ.
Below, check out the bullish price action of a few leading stocks we are monitoring for potential buy entry:
Fastly
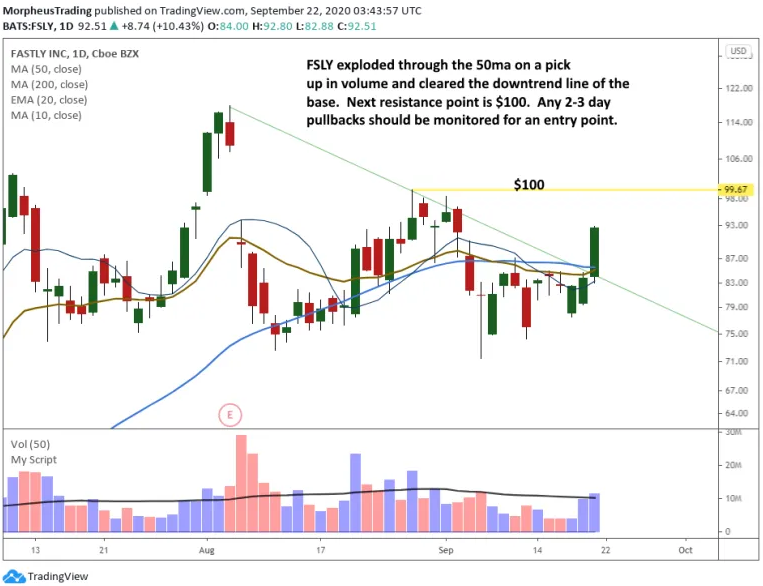
FSLY is a top-ranked stock we previously traded for a +51% gain back in July.
Fastly (NYSE:FSLY) underwent a healthy correction after a massive bull run, but the stock is once again back on our radar after blasting back above its 50-day moving average Monday.
Datadog
Another must-own leading stock for us is cloud software provider Datadog (NASDAQ:DDOG).
DDOG closed above its 50-day moving average on a pick up in volume, and may finally be ready to move higher after several weeks of constructive basing action:
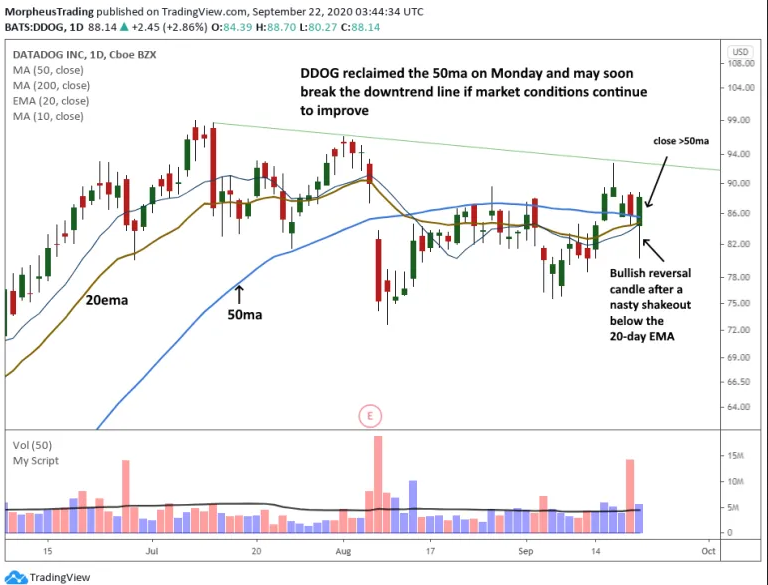
Note that DDOG is listed as an “official” buy setup in yesterday's report.
Square
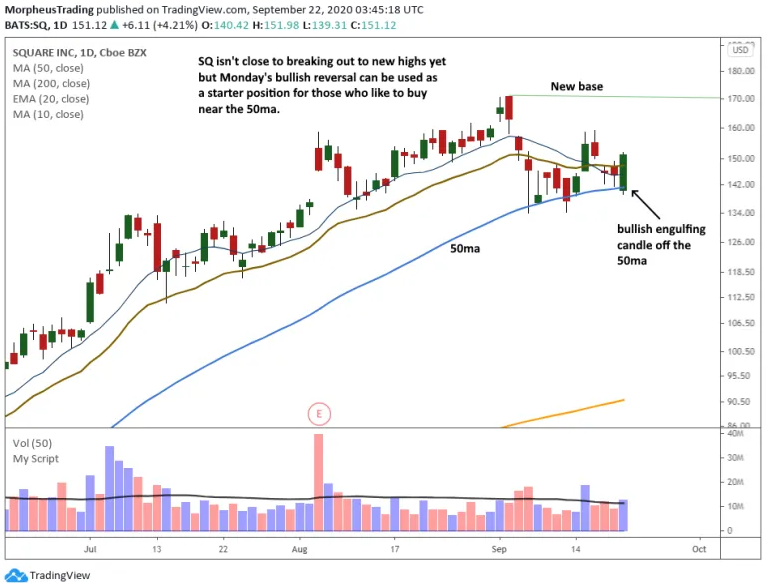
SQ convincingly found support and bounced off its 50-day MA with a bullish engulfing candle.
An “engulfing” candle occurs the day after a down day, where the price opens below the prior down day’s close, then closes above the prior down day’s open.
On the chart below, notice how the green body of September 21 engulfed the prior day’s red body.
This reversal is a buy signal for those who don’t mind entering closer to the 50-day MA with a starter position:
Invitae
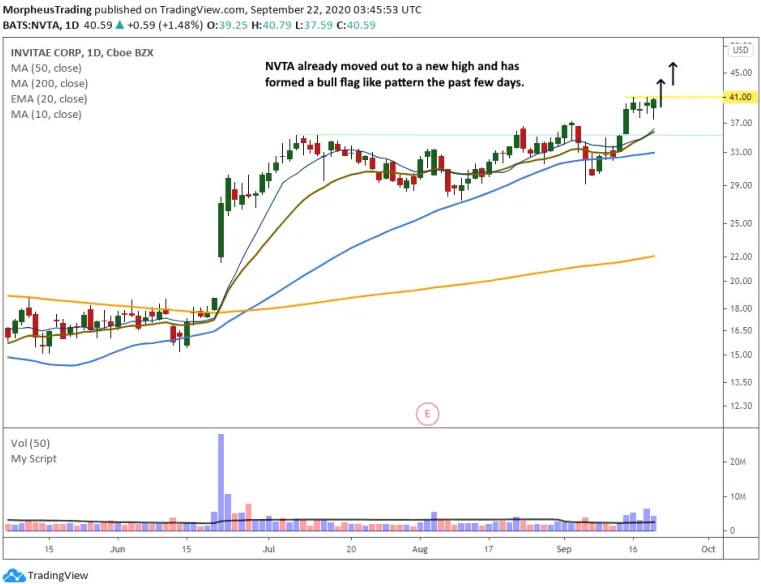
NVTA is a stock with great relative strength that is trading at a new high, even while the Nasdaq is in correction mode.
When a stock goes steadily higher while the broad market moves steadily lower, that’s a clear sign of impressive relative strength.
A move above last week’s high could spark the next wave up:
Plan the trade, trade the plan
The September 21 price and volume action was a step in the right direction for the stock market.
However, it’s too soon to get aggressive on the long side because it was only Day 1 of a new rally attempt.
We still need to see more evidence that a new bull market is underway before we can load up on new positions in our model portfolio.
