
Wednesday's efforts to break above the mid-June highs got thoroughly tested yesterday, and the stock bulls barely managed to stage a comeback. Is that a warning shot fired by the bears, or a show of strength by the bulls?
I think I have an answer for that – and it might surprise you. It's that it's neither – neither the bears, nor the bulls did really show they were strong yesterday.
As such, I wouldn't read too much into the rocky nature of yesterday's S&P 500 move, or into today's premarket ones for that matter. I would focus on the big picture – on answering whether the stock bull run is intact or not.
Was yesterday's volume convincing in any way? How is the weekly candlestick shaping up? What about the credit markets? Any strong hints the small caps are sending? Does the tech still lead, or not?
These are the facts you'll see examined in today's article, and they still lead me to think that the stock uptrend has more chances of renewing itself than not.
The bulls are still slated to prevail in the clashing narratives and facts on the ground:
I say so despite the uptrend in new U.S. COVID-19 cases that has many states stepping back from the reopening, rekindling lockdown speculations. I say so despite the Fed having its foot off the pedal in recent weeks, which makes for more players looking at the exit door.
The put/call ratio slightly declined, the dollar stopped materially rising in the very short run, and emerging markets aren't exactly breaking down. Central banks are standing ready to act, and money printing remains in our future. The greatest real policy risks I see, concern lockdown miscalculations and new stimulus measures.
Q2 earnings are ahead, and Democratic hopeful Joe Biden laid out his economic plans, calling for corporate America to pay its fair share in taxes. How would that work for E in the P/E ratio? But jobs coming
back (to be seen in declining continuing claims), is a more immediately pressing matter right now.
First things first – let's dive into yesterdays S&P 500 performance.
S&P 500 In Short- and Medium-Run
I’ll start with the daily chart perspective (charts courtesy of http://stockcharts.com ):
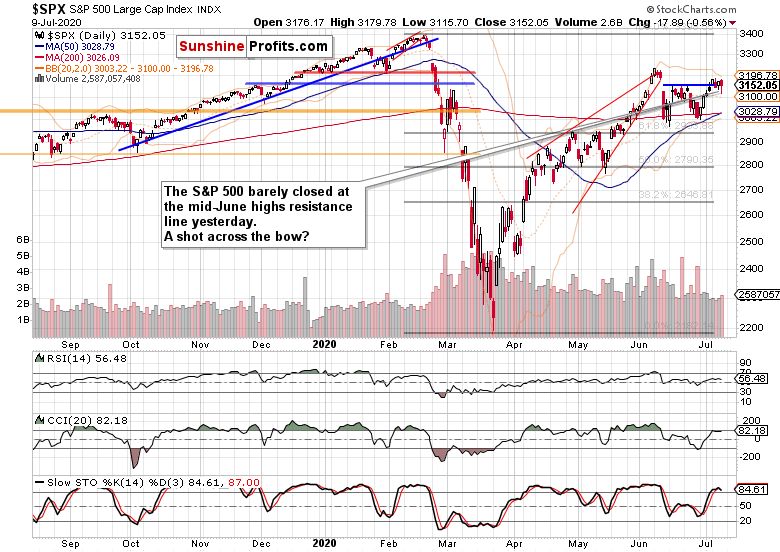
The second peek above the horizontal line connecting mid-June tops, didn't stick, and the S&P 500 bulls had a hard time reversing intraday losses. Yet, prices closed at the resistance. The volume isn't sending signals that a particularly fierce battle has been fought – it looks like a rather average one. In other words, back-and-forth trading during a relatively calm week.
The weekly chart in progress highlights the short-term indecision – please visit this free article on my home site so as to see the annotated weekly chart and more. Yet, the swing structure still favors the upswing to continue – today's close will be telling.
Whenever markets start acting jittery, it pays to remember the daily chart's big picture:
Recapping the obvious, stocks are on the upswing after the bears just couldn't break below the 200-day moving average, which means that the momentum is with the bulls now. The daily indicators keep supporting the unfolding upswing, and volume doesn't raise red flags either.
Until I see credible signs that the markets are getting spooked by corona, botched policy responses or anything else, there is little point in acting as if the sky is falling. It isn't the case – to be clear, the time to turn really bearish would come, but we're not there yet.
That was it for the illustration of zoomed out perspectives. It certainly seems premature to call for a market breakdown, given what I am going to write next.
The Credit Markets’ Point of View
Just like the S&P 500 yesterday, high yield corporate bonds ((NYSE:HYG) ETF) opened encouragingly. Early gains turned into quite steep losses, but the beaten down bonds caught a bid to close relatively little changed.
On one hand, there wasn't real willingness to sell more heavy, on the other hand, an upside reversal would call for higher accumulation than we have seen. Thus, we might need to go through some more of the current relatively directionless trading before seeing a decisive move. Still, upswing continuation is the favored eventual outcome here.
Investment grade corporate bonds ((NYSE:LQD) ETF) though present a bullish chart. They have reversed Wednesday's losses, and rose mightily, which bodes well for the HYG ETF down the road.
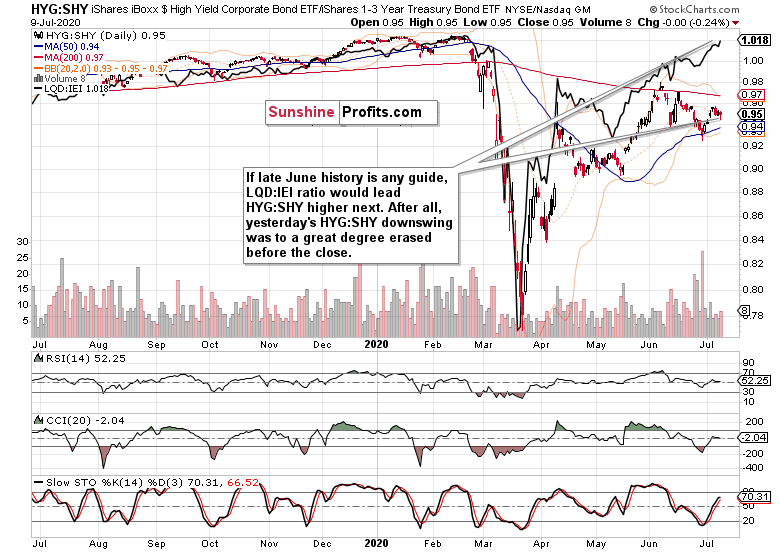
The caption covers it all, as the LQD:IEI ratio appears ready to lead HYG:SHY higher. Just like I said yesterday, the overreaching dynamic is one of an uptrend, which is why I look for the daily non-confirmation to be resolved with an upside move, in both ratios.
A look at the HYG:SHY chart with the overlaid S&P 500 closing prices reveals that we haven't really seen a ground-breaking move that would have messed with the recent dynamics of their relationship.
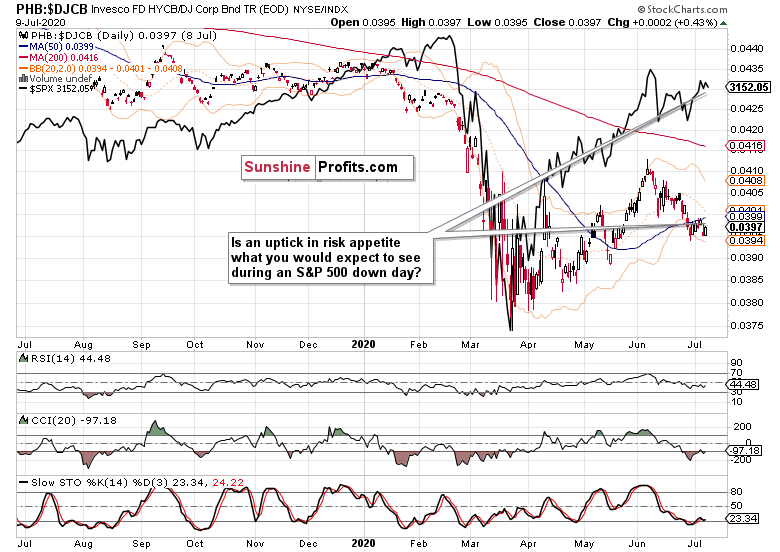
The ratio of high yield corporate bonds to all corporate bonds (PHB:$DJCB) has ticked up yesterday, which isn't exactly what to expect in any stock slide's opening chapter. That increases the likelihood of the HYG:SHY upswing to reassert itself.
Credit markets are telling me that the sky isn't falling – should I see it start to, I'll change my mind and let you know about it. With the Fed waiting in the wings, the path of least resistance remains higher. And don't forget about the infrastructure bill or the second stimulus cheque either.
Market Breadth, Small Caps and Technology
Market breadth isn't sending clear signals apart from moving to the bearish territory in the short run. Arguably, that makes its rebound in the coming week likely, as the late-April and late-June experience shows. I don't see a proof that the market character would have changed.
Yes, Russell 2000 (IWM ETF) underperformance goes on, but I can't say that small caps would be breaking down right now.
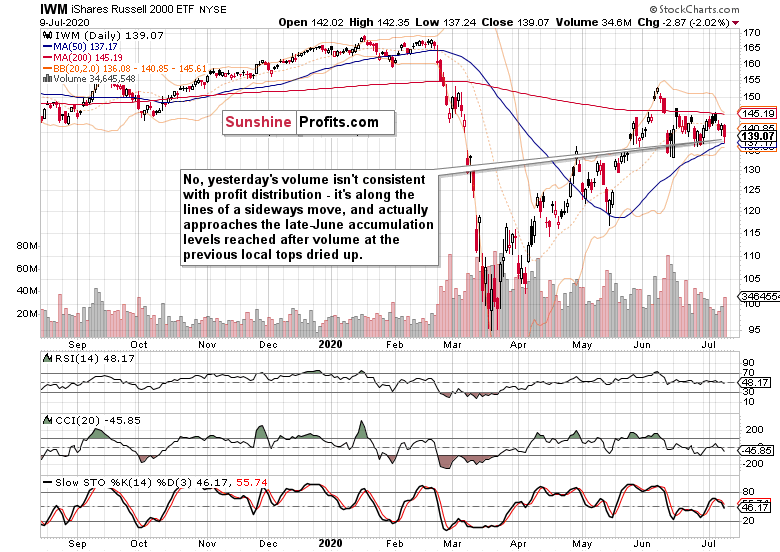
Yesterday's volume doesn't scream that distribution is here. Actually, its level isn't out of the ordinary, and given the values seen at previous local bottoms and tops, it favors the Russell 2000 upswing to restart, as the caption says.
If I saw IWM ETF weakening while the individual stock heavyweights in the S&P 500 went higher still, that would be concerning. That's because once the small caps roll over to the downside, the S&P 500 would follow eventually as the generals wouldn't just prop it up indefinitely. And this isn't happening.
Technology ((NYSE:XLK) ETF) certainly isn't going to hell in a hand basket. While prices are extended, yesterday's session showed that buy the dip still rules. In a such a strongly bullish chart, it's dangerous to be calling tops. Semiconductors ((NYSE:XSD) ETF) certainly hint at the tech upswing having further to go. It's not merely because of their greater intraday strength yesterday – it's that just like tech, they are also trading at new 2020 highs.
I don't see a deterioration in this leading segment that would justify turning bearish on tech. Or on the S&P 500 for that matter.
Summary
Summing up, Thursday's decline in the S&P 500 isn&'t of a world-ending nature. Given the credit market performance, it's most likely merely a short-term hiccup for the stock bulls to deal with. Amid the market breadth deterioration, there are encouraging signs speaking for an uptick in risk-on appetite. Technology and semiconductors certainly don't appear to be on their last legs. Once the upswing across the corporate bonds gathers steam again, stocks would get the much needed ally to break above the short-term resistance formed by the mid-June tops.