
The analysis below illustrates why Skechers USA Inc (NYSE:SKX) has big upside potential prior to reporting earnings this week.
Earnings Expected Thursday
Skechers is expected to report earnings on Thursday, October 18th after the market closes. Shares are down 5% over the last month and down 50% since August 2015 due to the footwear company’s slowing revenue growth. During this period, however, Skechers has beat its revenue estimate on five occasions while missing its estimate only three times.
As illustrated in the table below, Skechers investors typically see big stock movements around earnings. The stock has increased 7.1% on average when management reports a revenue beat. But shares have retreated an average of 23.5% when management reports a miss.
Needless to say, investors will be watching the company’s top line on Thursday.
Total Sales Growth Picking Back Up
Skechers total revenue stands at $3,563 million as of fiscal year ending December 2016. This is 121.9% higher than the $1,606 million achieved in fiscal year December 2011 and represents a five-year compounded annual growth rate (CAGR) of 17.3%. Pretty impressive!
What has investors concerned is the deceleration of that growth since Q1'16. On a quarterly basis, Skechers’ year-over-year sales growth hit a recent low of only 5.8% in Q4'16 but has since picked back up reaching 16.9% in its latest reported quarter.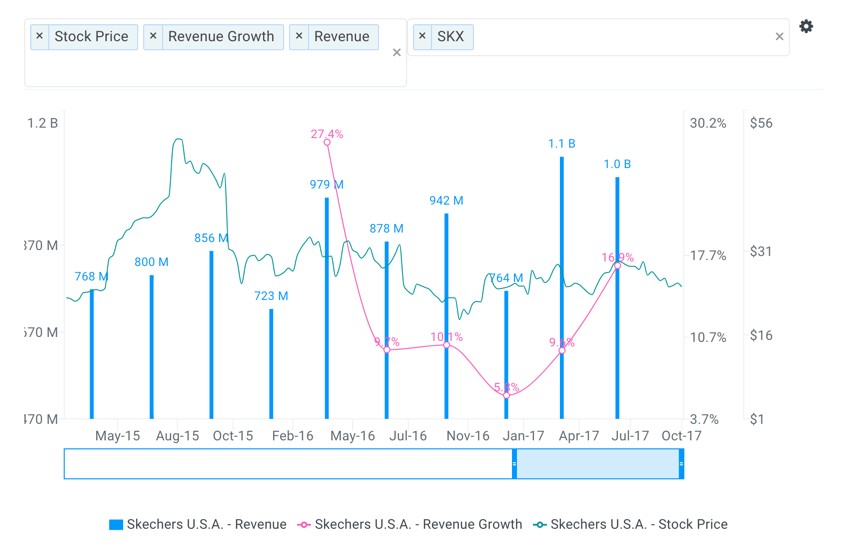
source: finbox.io
Going forward, analysts forecast that the company’s sales will reach $5,570 million by fiscal year 2021 representing a five-year CAGR of 9.3%. For Q3'17 expected to be announced on Thursday, the consensus Wall Street estimate of $1,070 million implies 13% YoY growth.
It’s important to note that analysts often look at companies as either thriving, surviving or dying. Analyzing a company’s revenue growth can help distinguish between these stages. Growth of over 10% typically signifies the core business is doing very well and the company’s products and services are in demand. On the other hand, a decline of 10% or more is an indicator that the company is in real trouble and that its products or services are losing demand and/or becoming irrelevant.
When looking at the stock’s recent performance, you would assume the business is deteriorating. But in reality, the Skechers brand remains strong and is still growing at a very healthy pace.
Domestic Wholesale Headwinds Overblown
Skechers breaks out its top-line into three segments: Domestic Wholesale, International Wholesale and Retail (includes e-Commerce). In the early part of 2017, analysts downgraded the stock due to increasing concern over the domestic wholesale business and rightfully so. Skechers posted four straight quarters of declining growth from Q2'16 to Q1'17. However, during this same period, total sales continued to grow on average of 8.8%.
Then last quarter (Q2'17) Skechers reported that its Wholesale business grew by 6.4% YoY while total sales increased by 16.9%, a level the company hadn’t reached since Q1'16. It appears the company is ready to get back to its high growth levels while concern over the Wholesale Business were overblown.
To put it plainly, the athletic retail business is shifting and companies are just beginning to adapt. Many active-wear brands such as Nike (NYSE: NYSE:NKE), Under Armour Inc A (NYSE:UAA) and Skechers are focusing on selling their products directly to consumers rather than through distribution partners. For example, Skechers retail business (includes e-Commerce) sales grew 28.7% in Q2'17. This is impressive when comparing to Nike and Under Armour who grew their direct-to-consumer sales by 18% and 20%, respectively.
It appears consumers still want Skechers’ products while management is just shifting its delivery method. Furthermore, growth in China has been a bright spot for the company selling 3.7 million shoes last quarter (61% growth). Management previously projected that China would contribute $500 million in sales for fiscal year 2017. Expect further confirmation on this number Thursday.
Why Value Investors Are Bullish SKX
Skechers’ stock trades at a highly attractive valuation. Applying Wall Street estimates to ten separate cash flow analyses implies that shares are 45% undervalued. Additionally, the Wall Street consensus price target of $32.45 per share implies 33% upside.
source: finbox.io
Skechers is also highly attractive on a relative basis when compared to several of its publicly traded peers: Foot Locker (NYSE:FL), Deckers Outdoor Corporation (NYSE:DECK), Wolverine World Wide Inc (NYSE:WWW) and Columbia Sportswear Company (NASDAQ:COLM).
The company’s LTM EBITDA multiple of 7.4x is below comparable companies DECK (10.1x), WWW (16.5x) and COLM (11.3x) while only above FL (2.7x). Similarly, Skechers’ LTM P/E multiple of 17.1x is only above FL (6.4x) and well below DECK (94.2x), WWW (32.3x) and COLM (21.8x).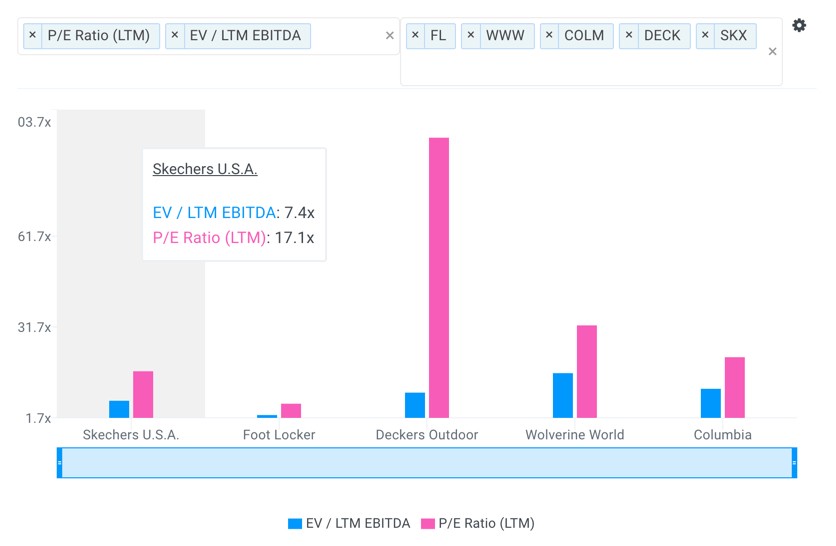
source: finbox.io
Furthermore, most Wall Street analysts have either upgraded or reiterated their buy ratings on SKX shares since June. Citigroup (NYSE:C) pointed to positive signals such as a new product cycle as well as indications that the footwear maker is capturing market share from competitors.
Then Cowen’s John Kernan called Skechers its top small-midcap idea in a note to clients highlighting management’s potential to leverage down S&G expenses in the back half of the year.

source: marketbeat
As previously mentioned, Skechers has healthy growth prospects as a result of strong company-owned retail store trends and international opportunities. However, while positive revenue trends are important, equally important is the ability to convert those revenues into real earnings or cash flow. Note how Skechers’ EBITDA margins have recently come under some pressure in the chart below.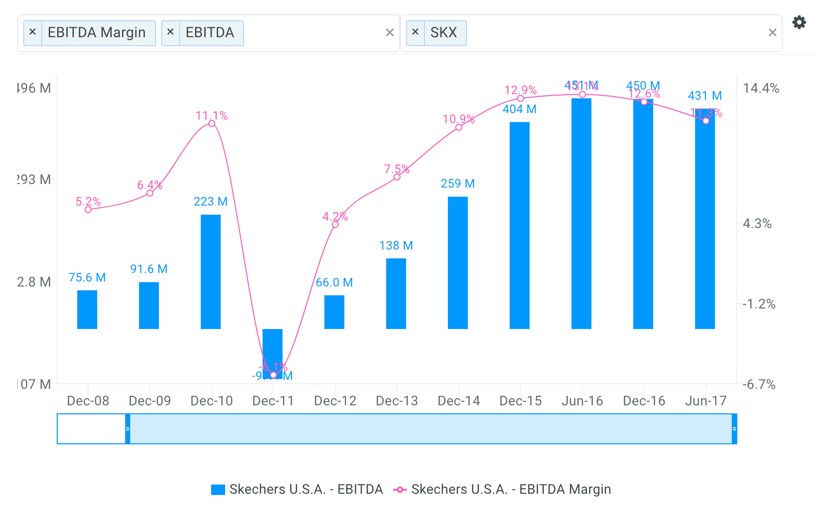
source: finbox.io
For the full year 2017, analysts forecast that the company’s EBITDA will drop 5% to $427 million implying a margin of 10.6%. However, the consensus forecast also has Skechers’ EBITDA margin getting back to over 12% by fiscal year 2019.
I built a five-year discounted cash flow (DCF) downside case for Skechers below assuming that margins do not pick back up (stay at 10.6% into perpetuity). I also assume sales growth declines to 3.5% by 2021, a weighted average cost of capital (WACC) of 9.5% and a terminal growth rate at the end of the forecast period of 2%. This results in a fair value of $27.59 which still implies nearly a 15% margin of safety.
source: finbox.io
The downside DCF analysis illustrates just how undervalued shares of Skechers appear.
Overall, the Skechers’ brand remains strong in a tough retail market as illustrated by its ability to achieve healthy growth figures. Whether or not the company beats its estimates on Thursday, this footwear retailer has nice upside on a long-term basis and should be further considered by value investors.