
A month has gone by since the last earnings report for Iron Mountain Incorporated (NYSE:IRM) . Shares have lost about 3.9% in that time frame.
Will the recent negative trend continue leading up to its next earnings release, or is IRM due for a breakout? Before we dive into how investors and analysts have reacted as of late, let's take a quick look at the most recent earnings report in order to get a better handle on the important catalysts.
Iron Mountain Beats on Q1 Revenues, Maintains Outlook
Iron Mountain reported first-quarter 2018 normalized FFO of 49 cents per share, missing the Zacks Consensus Estimate of 50 cents. However, the figure increased 2.1% year over year.
Adjusted FFO increased 30% year over year to $222 million, mainly reflecting growth in adjusted EBITDA.
Quarter In Detail
Revenues of $1.04 billion beat the Zacks Consensus Estimate of nearly $1.03 billion and improved 11% year over year. At constant dollar basis, revenues climbed 8 % from the year-ago quarter. Storage revenues (62.5% of total revenues) came in at $651 million in the quarter and denoted 10.7% increase on a constant dollar basis. Internal growth was 3.7% year over year.
Storage segment generated 43.9% of total revenues from the developed markets (North America Records and Information management, North America Data Management and Western Europe) and 12.6% from Other International markets (emerging markets, Australia and New Zealand).
In developed markets storage, internal revenue growth was 2.9%. In Other International markets storage, internal revenue growth came in at 5.6% year over year. Internal storage rental revenues were up 5.6% in emerging markets.
Service revenues (37.5% of total revenues) amounted to $391 million in the quarter, indicating an increase of 3.7% on a constant dollar basis. Internal growth inched up 1.4% year over year. Service internal revenue growth in developed markets and Other International markets growth came in at 1.0% and 4.4%, respectively.
Adjusted gross profit margin expanded 160 basis points (bps) on a year-over-year basis to 57.0%. Moreover, adjusted EBITDA margin improved 170 bps to 32.9%. Year-over-year growth was driven by the robust performance from North America Records and Information management (RIM), Western Europe and Global Data Center, which surged 150 bps, 380 bps and 2040 bps, respectively.
Guidance
Iron Mountain maintained its guidance for 2018.
On a constant dollar basis, the company expects revenues in the band of $4,160-$4,260 million, denoting increase of 7-9%, and adjusted EBITDA of $1,435-$1,485 million, indicating growth of 12-16%. Moreover, adjusted FFO is anticipated in the range of $805-$865 million, highlighting 5-13% rise.
Internal storage rental revenue growth rate for 2018 is projected at 3-3.5%. Total internal revenue growth is expected in the range of 2-3%.
How Have Estimates Been Moving Since Then?
In the past month, investors have witnessed a downward trend in fresh estimates. There have been two revisions lower for the current quarter.
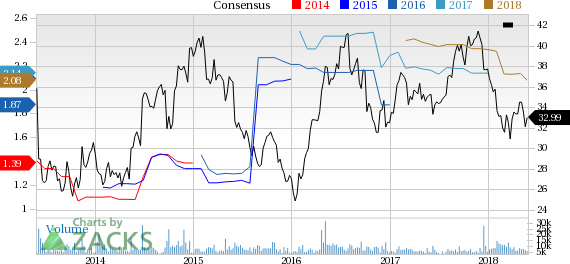
Iron Mountain Incorporated Price and Consensus
VGM Scores
At this time, IRM has a nice Growth Score of B, though it is lagging a lot on the momentum front with an F. However, the stock was allocated a grade of C on the value side, putting it in the middle 20% for this investment strategy.
Overall, the stock has an aggregate VGM Score of C. If you aren't focused on one strategy, this score is the one you should be interested in.
Our style scores indicate that the stock is more suitable for growth investors than value investors.
Outlook
Estimates have been broadly trending downward for the stock and the magnitude of these revisions indicates a downward shift. Interestingly, IRM has a Zacks Rank #3 (Hold). We expect an in-line return from the stock in the next few months.
Iron Mountain Incorporated (IRM): Free Stock Analysis Report
Original post
Zacks Investment Research