A month has gone by since the last earnings report for Caterpillar Inc. (NYSE:) . Shares have lost about 4.1% in that time frame, underperforming the market.
Will the recent negative trend continue leading up to its next earnings release, or is CAT due for a breakout? Before we dive into how investors and analysts have reacted of late, let's take a quick look at its most recent earnings report in order to get a better handle on the important drivers.
Caterpillar Q4 Earnings Beat, '18 View Upbeat
Caterpillar reported an impressive surge of 160% year over year in fourth-quarter 2017 adjusted earnings per share to $2.16. Earnings also surpassed the Zacks Consensus Estimate of $1.77 by a margin of 22%. After a string of dismal performances for four years, Caterpillar witnessed a turnaround through 2017 on the back of improving end markets and its relentless focus on cost control. The fourth-quarter performance marked the company’s fourth consecutive quarter of both top and bottom-line growth. Consequently, Caterpillar’s shares advanced 1.88% in pre-market trading.
Overall for the year, the company delivered an impressive 101% year-over-year improvement in earnings. Driven by strong order rates, lean dealer inventories, increasing backlog and expectation of higher sales volume, the company has initiated fiscal 2018 earnings per share guidance range of $8.25-$9.25, which reflects a 27% year-over-year rise at the mid-point reflecting higher sales volume across its three primary segments.
Including one-time items, Caterpillar reported a loss per share of $2.18 in the quarter compared with a loss per share of $2.00 in the prior-year quarter. This includes several large adjustments for the impact of U.S. tax reform, restructuring costs, mark-to-market losses for remeasurement of pension and OPEB plans, state deferred tax valuation allowance adjustments, gain on sale of an equity investment in 2017 and a goodwill impairment charge in 2016.
Revenues Improve Across All Regions & Markets
Revenues improved 35% year over year to $12.9 billion in the quarter, surpassing the Zacks Consensus Estimate of $11.9 billion. The company witnessed higher sales volume owing to improved end-user demand and favorable changes in dealer inventories. End-user demand improved across all regions and most end markets.
Higher Sales Drive Improved Profits
In the reported quarter, cost of sales increased 18% year over year to $8.9 billion. Gross profit soared 97% to $4 billion. Selling, general and administrative (SG&A) expenses increased 8% to $1.6 billion. Research and development (R&D) expenses rose 11% year over year to $579 million.
Adjusted profit before taxes were pegged at $1.7 billion, a substantial improvement from $0.6 billion in the prior-year quarter. Higher sales volume, favorable price realization and lower variable manufacturing costs were offset by higher period costs. Variable manufacturing costs were lower in the quarter due to the favorable impact from cost absorption and lower warranty expense. Period costs were higher primarily due to higher short-term incentive compensation expense.
All Segments Deliver Growth
Machinery and Energy & Transportation (ME&T) sales surged 37% year over year to $12.2 billion. Sales of Energy & Transportation gained 22%, owing to higher sales across all applications. Sales at Resource Industries improved 53% due to higher sales volume for both equipment and aftermarket parts as well as favorable price realization. Construction Industries sales rose 47% driven by favorable impact of changes in dealer inventories as well as higher end-user demand for construction equipment. Sales increased across all regions with the North America and Asia/Pacific leading the pack.
The ME&T segment reported an operating profit of $1.09 billion against the operating loss of $1.34 million in the year-ago quarter. At the Energy & Transportation segment, operating profit improved 38% to $881 million due to higher sales volume, partially offset by higher period costs. The Resource Industries reported operating profit of $209 million in the quarter versus $711 million loss incurred in the prior-year quarter thanks to higher sales volume and favorable price realization. Construction Industries’ profit soared 151% to $838 million due to favorable price realization, higher sales volume and variable manufacturing efficiencies. However, unfavorable period costs and higher material costs, primarily for steel somewhat negated these gains.
Financial Products’ revenues went up 6% to $783 million. Financial Products' profit was $233 million in the quarter up from $149 million in the prior-year quarter. The increase can be attributed to higher gains on sales of securities at Insurance Services and an increase in net yield on average earning assets.
Financial Position
Caterpillar ended 2017 with cash and short-term investments of $8.3 billion, up from $7.2 billion at 2016 end. The debt-to-capital ratio at ME&T was 36.7% as of 2017 end, lower than 41% as of 2016-end, and within the company’s target range of 30-45%. Operating cash flow at ME&T was at $5.5 billion in 2017 compared with $3.9 billion in the prior year. In the reported quarter, the company made a discretionary contribution to U.S. pension plans of $1 billion and a payment for early debt retirement of $958 million.
Robust Backlog
At the end of 2017, Caterpillar’s backlog was at $15.8 billion, up from $15.4 billion at third-quarter end. The increase was mainly driven by higher backlog Resource Industries. Backlog at Construction Industries remained flat while the company witnessed a decline in backlog at the Energy & Transportation segment. On a year-over-year basis, order backlog improved by about $3.7 billion driven by improvement across both Construction and Resource Industries.
Fiscal 2017 Results Trumps Guidance, Estimates
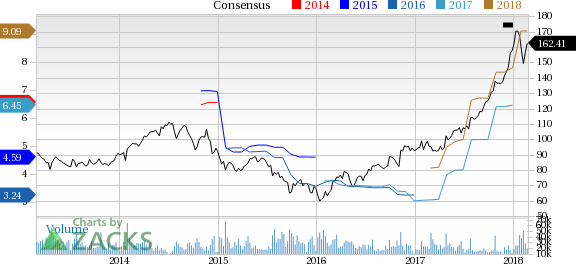
Caterpillar’s adjusted earnings per share in fiscal 2017 was $6.88 compared with $3.42 in fiscal 2016. Earnings outpaced the Zacks Consensus Estimate of $6.47 as well as the company’s guidance of $6.25. Including one-time items, earnings were pegged at $1.26 for the year compared with loss per share of 11 cents in the prior fiscal.
Revenues came in at $45.5 billion that beat the Zacks Consensus Estimate of $44.2 billion and also improved 18% on a year-over-year basis. The company had guided revenues at $44 billion.
Upbeat Guidance for 2018 Initiated
Strong sales momentum resulting from strong order rates, lean dealer inventories and an increasing backlog bode well for an improved 2018 performance. Given these factors, along with positive economic indicators globally and many of the company’s end markets, Caterpillar initiated adjusted earnings per share guidance range of $8.25-$9.25 for fiscal 2018. All the segments are expected to log growth in the year.
How Have Estimates Been Moving Since Then?
Analysts were quiet during the last month as none of them issued any earnings estimate revisions.
VGM Scores
Currently, CAT has an average Growth Score of C, however its Momentum is lagging a bit with a D. The stock was also allocated a grade of D on the value side, putting it in the bottom 40% for this investment strategy.
Overall, the stock has an aggregate VGM Score of D. If you aren't focused on one strategy, this score is the one you should be interested in.
Our style scores indicate that the stock is suitable for growth investors.
Outlook
CAT has a Zacks Rank #2 (Buy). We expect an above average return from the stock in the next few months.
Caterpillar Inc. (CAT): Free Stock Analysis ReportOriginal postZacks Investment Research