
It has been about a month since the last earnings report for Arthur J. Gallagher & Co. (NYSE:AJG) . Shares have lost about 5.9% in that time frame.
Will the recent negative trend continue leading up to its next earnings release, or is AJG due for a breakout? Before we dive into how investors and analysts have reacted as of late, let's take a quick look at its most recent earnings report in order to get a better handle on the important catalysts.
Arthur J. Gallagher Beats on Q1 Earnings and Revenues
Arthur J. Gallagher & Co. reported first-quarter 2018 adjusted net earnings of $1.52 per share, which beat the Zacks Consensus Estimate by about 0.7%. Also, the bottom line improved 10.9% on a year-over-year basis.
The company’s performance was driven by solid organic growth, outstanding revenue improvement from the tuck-in mergers and acquisitions and a strong margin expansion. The company also witnessed a sturdy performance across all segments.
Net income rose 16.5% year over year to $1.48 per share.
Operational Update
Total revenues were $1.8 billion, up 11.6% year over year. This upside was driven by higher total revenues in the Brokerage, Risk Management as well as Corporate segments. Moreover, the top line surpassed the Zacks Consensus Estimate by 11.4%.
Total commissions and fees earned increased nearly 10.4% year over year to $1.3 billion in the quarter under review.
Arthur J. Gallagher’s total expense rose 10.3% year over year to $1.6 billion in the reported quarter. Expenses escalated due to a rise in compensation costs, operating costs, reimbursements, interest expenses, cost of revenues from clean coal activities plus higher depreciation and amortization expenses.
Earnings before interest, tax, depreciation and amortization and change in estimated acquisition earnout payables (EBITDAC) increased 13.3% to $379.8 million.
Segment Results
Brokerage: Adjusted revenues of $1.2 billion grew 7.7% year over year on higher fees, commissions, supplemental revenues and investment income plus gains realized on books of business sales. Total expense shot up nearly 8.4% year over year to $876.7 million.
Adjusted EBITDAC rose 9.2% to $415.2 million.
Risk Management: Adjusted revenues were up 9.5% year over year to $195.1 million, mainly owing to higher fees. Total expenses increased 10.9% year over year to $208.3 million.
Adjusted EBITDAC climbed 4.9% year over year to $32.1 million.
Corporate: Total revenues came in at $412.2 million, up 17.2% year over year. Total expenses increased 13.3% year over year to $510.4 million.
EBITDAC was at a loss of $59.9 million, wider than the loss of $52.4 million in the prior-year quarter.
Financial Update
As of Mar 31, 2018, total assets were $16.1 billion, up 8.2% from year-end 2017.
Cash and cash equivalents at the year-end rose 2.5% from the 2017-level to $681.2 million.
Shareholders’ equity increased about 6.6% from the 2017-end level to $4.6 billion as of Mar 31, 2018.
Acquisition Update
In the first quarter, the company closed six acquisitions with annualized revenues of about $26.7 million.
Business Update
Effective Jan 1, 2018, the company adopted a new revenue recognition accounting standard. As a result, the prior-year restated figures have been recognized.
How Have Estimates Been Moving Since Then?
In the past month, investors have witnessed a downward trend in fresh estimates. There have been three revisions higher for the current quarter compared to four lower.
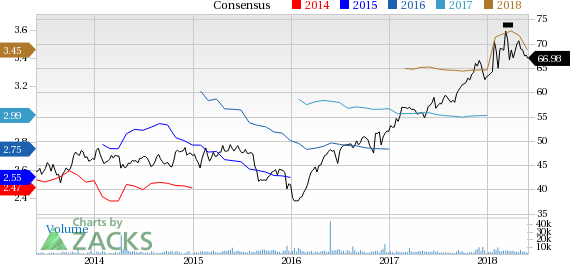
Arthur J. Gallagher & Co. Price and Consensus
VGM Scores
At this time, AJG has a poor Growth Score of F, however its Momentum is doing a lot better with a B. However, the stock was allocated a grade of D on the value side, putting it in the bottom 40% for this investment strategy.
Overall, the stock has an aggregate VGM Score of D. If you aren't focused on one strategy, this score is the one you should be interested in.
The company's stock is suitable solely for momentum based on our styles scores.
Outlook
Estimates have been trending downward for the stock and the magnitude of these revisions indicates a downward shift. It's no surprise AJG has a Zacks Rank #4 (Sell). We expect a below average return from the stock in the next few months.
Arthur J. Gallagher & Co. (AJG): Free Stock Analysis Report
Original post