
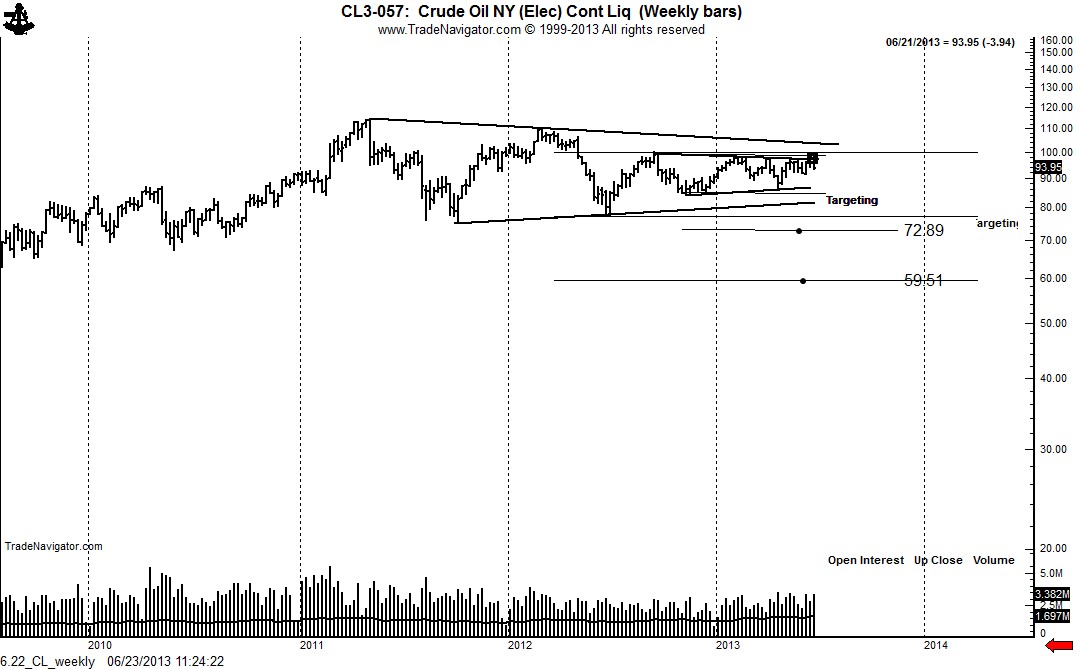
The monthly and weekly Crude Oil charts have been forming a 9-month triangle within a 3+ year triangle. This price behavior represents a tremendous amount of compression that will at some point be released.
Of great significance, in my opinion, was the upward price thrust in mid-June that completeed an inverted H&S and the smaller symmetrical triangle. This upward breakout has now proven to be a classic bull trap.
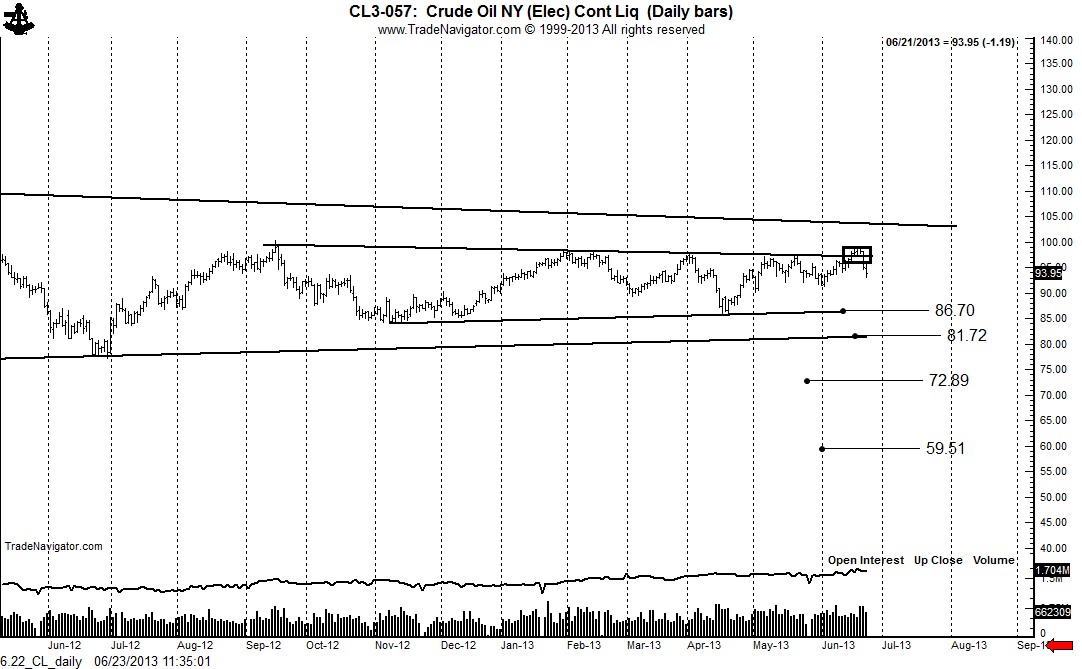
Targets are the lower boundary of the smaller triangle at 86.70, the lower boundary of the bigger triangle at 81.72, the target of the smaller triangle at 72.89 (assumed the completion of the smaller triangle) and the target of the larger triangle at 59.50 (let’s call it 65.00).
But, you might say, this kind of drop is impossible because producers must make money. Who says?? Markets in supply surplus (such as energy at the present time) tend to go the production price of the most efficient producers. Plus, who would have ever believed when Crude was at $1.48 in mid 2008 that prices would retreat to below $4o in just six months. So take your pet macro economic/fundamental scenario and burn it with the trash!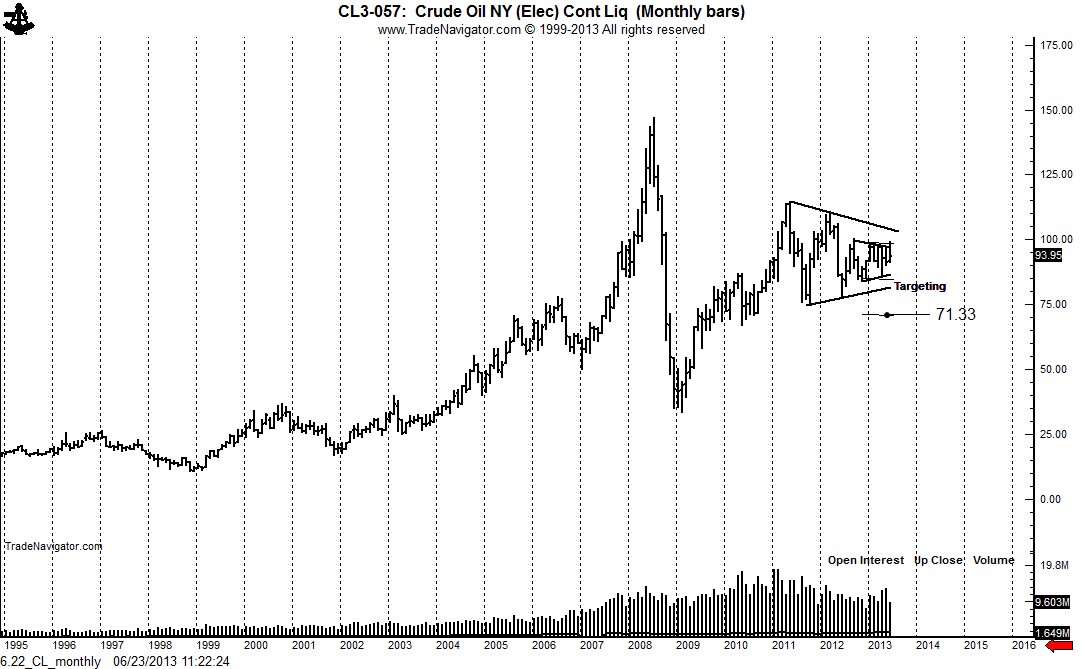
Disclaimers and caveats: I am short Crude Oil futures and will be stopped out if the market makes a new high. I am looking to add. Decisive closes below 85.90 and then below 77.25 are required to confirm a target of $65. The information in this blog post represents my own opinions and does not contain a recommendation for any particular security or investment. I or my affiliates may hold positions or other interests in securities mentioned in the Blog, please see my Disclaimer page for my full disclaimer.
- English (UK)
- English (India)
- English (Canada)
- English (Australia)
- English (South Africa)
- English (Philippines)
- English (Nigeria)
- Deutsch
- Español (España)
- Español (México)
- Français
- Italiano
- Nederlands
- Português (Portugal)
- Polski
- Português (Brasil)
- Русский
- Türkçe
- العربية
- Ελληνικά
- Svenska
- Suomi
- עברית
- 日本語
- 한국어
- 简体中文
- 繁體中文
- Bahasa Indonesia
- Bahasa Melayu
- ไทย
- Tiếng Việt
- हिंदी
Why I Am A $65 Bear In Crude Oil
Published 06/24/2013, 01:46 AM
Updated 07/09/2023, 06:31 AM
Why I Am A $65 Bear In Crude Oil
The charts could be an accident waiting to happen
3rd party Ad. Not an offer or recommendation by Investing.com. See disclosure here or
remove ads
.
Latest comments
Install Our App
Risk Disclosure: Trading in financial instruments and/or cryptocurrencies involves high risks including the risk of losing some, or all, of your investment amount, and may not be suitable for all investors. Prices of cryptocurrencies are extremely volatile and may be affected by external factors such as financial, regulatory or political events. Trading on margin increases the financial risks.
Before deciding to trade in financial instrument or cryptocurrencies you should be fully informed of the risks and costs associated with trading the financial markets, carefully consider your investment objectives, level of experience, and risk appetite, and seek professional advice where needed.
Fusion Media would like to remind you that the data contained in this website is not necessarily real-time nor accurate. The data and prices on the website are not necessarily provided by any market or exchange, but may be provided by market makers, and so prices may not be accurate and may differ from the actual price at any given market, meaning prices are indicative and not appropriate for trading purposes. Fusion Media and any provider of the data contained in this website will not accept liability for any loss or damage as a result of your trading, or your reliance on the information contained within this website.
It is prohibited to use, store, reproduce, display, modify, transmit or distribute the data contained in this website without the explicit prior written permission of Fusion Media and/or the data provider. All intellectual property rights are reserved by the providers and/or the exchange providing the data contained in this website.
Fusion Media may be compensated by the advertisers that appear on the website, based on your interaction with the advertisements or advertisers.
© 2007-2024 - Fusion Media Limited. All Rights Reserved.