Get 40% Off
🚨 Volatile Markets? Find Hidden Gems for Serious Outperformance
Find Stocks Now

Why Doesn’t The VIX Break?

Published 01/14/2021, 12:23 AM
Updated 09/20/2023, 06:34 AM

Stocks rose some on Jan. 13, but the S&P 500 has still been unable to take out Friday’s closing high. To some degree, that is surprising to me. It has been nearly three days, and what was a powerful closing level on Friday has been difficult for the index to move above.

What also concerns me is that this coming Friday is an options expiration date, and we should begin to see market makers unloading over hedged positions. The amount of options trading taking place in the market and the moves it creates in some stocks is really amazing. The open interest levels for expiration this Friday is almost on par with December’s expiration date.
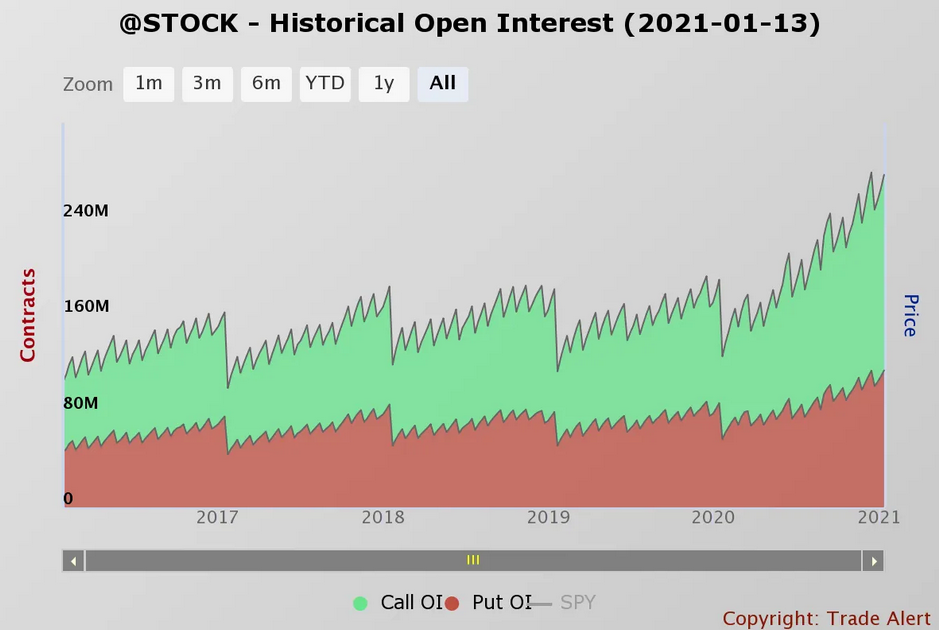
Stock - Historical Open Interest

Meanwhile, the VIX doesn’t go down, and perhaps the explosion in options volume has permanently shifted the structure of the implied volatility pricing. After all, with all of the options trading taking place, shouldn’t the dealer be able to make a little extra? If that is the case, then perhaps the VIX at 22 is the new 12.

What is most strange is that the VIX volatility index, VVIX, is actually diverging from the VIX. Meaning, as the VIX is falling, the VIX volatility index is rising.
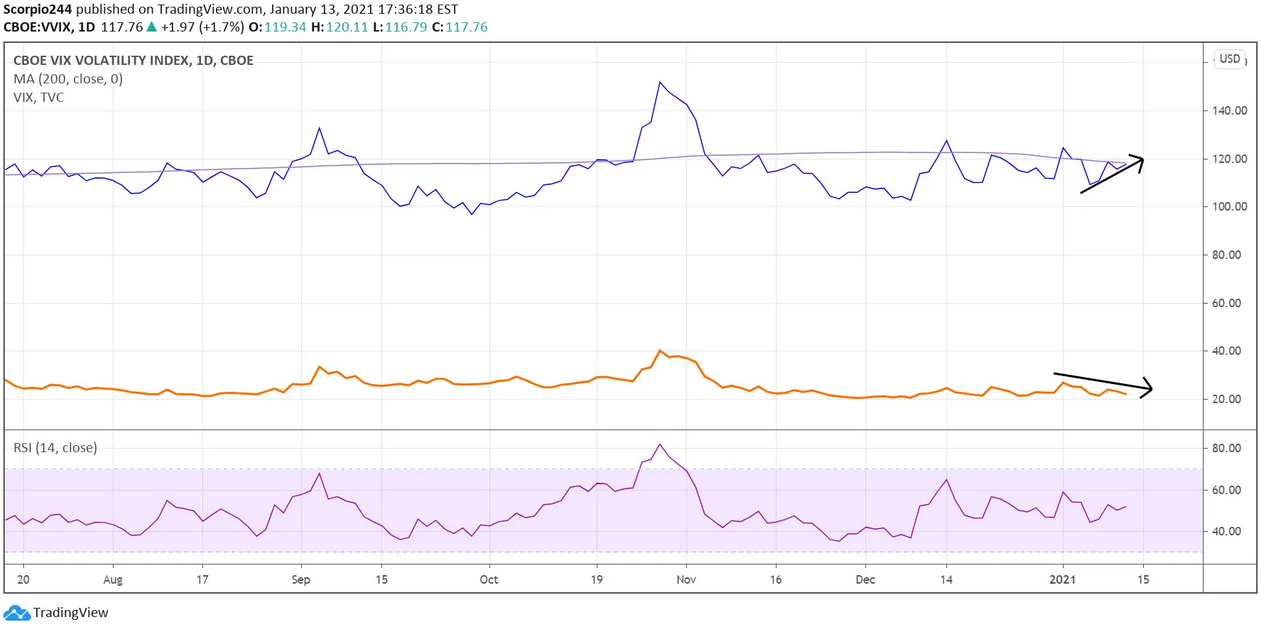
CBOE VIX Index Daily Chart

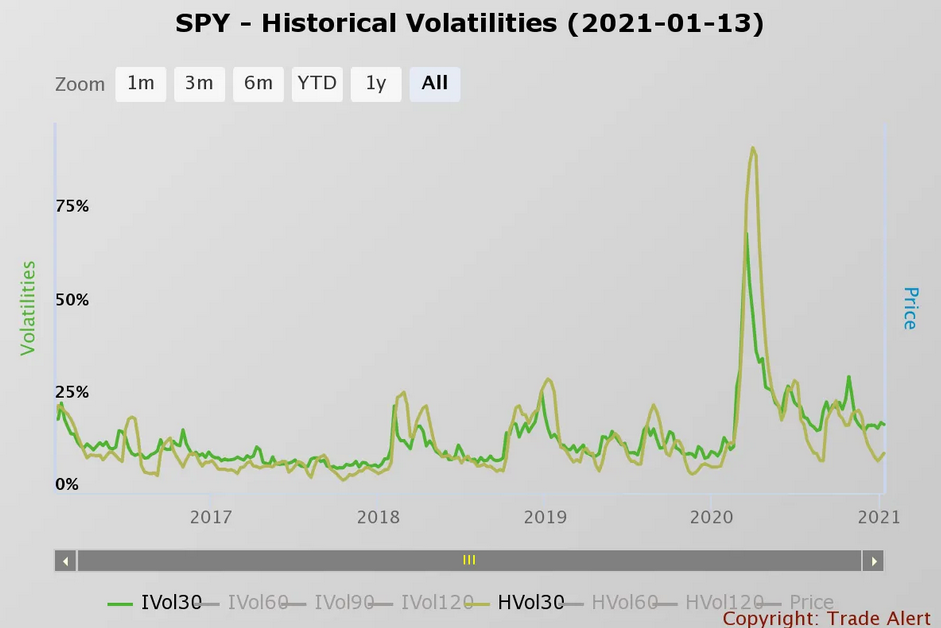
Implied volatility on the S&P 500 is much higher than the historical volatility. This is a trend that typically is followed by a surging realized volatility. So, we can patiently wait for the shoe to drop. When it will drop, and what will cause it to drop, is the big mystery.
3rd party Ad. Not an offer or recommendation by Investing.com. See disclosure here or remove ads .

SPY Historical Volatilities

It is worth noting that the one index that continues to make new highs is the most shorted index.
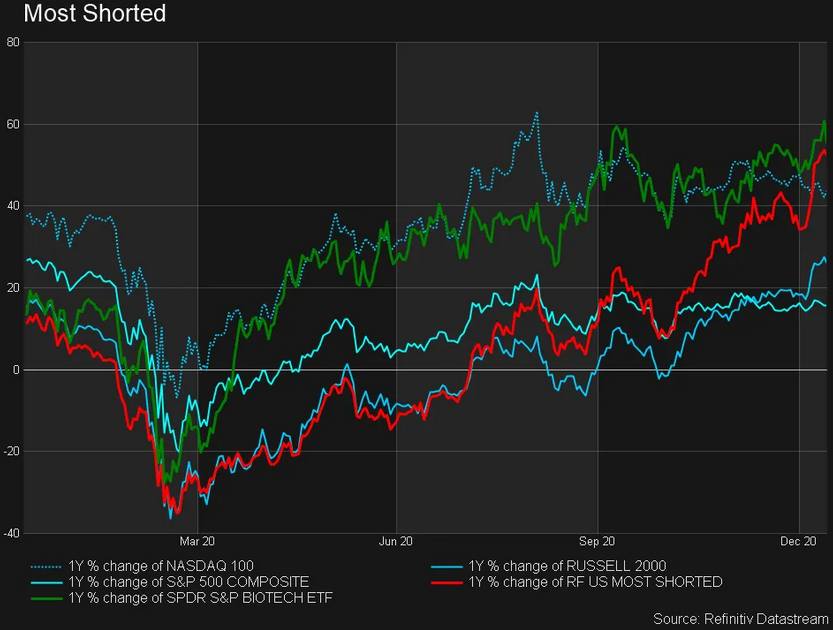
Most Shorted

Anyway, maybe we should all mark our calendars for Feb. 9, just in case.
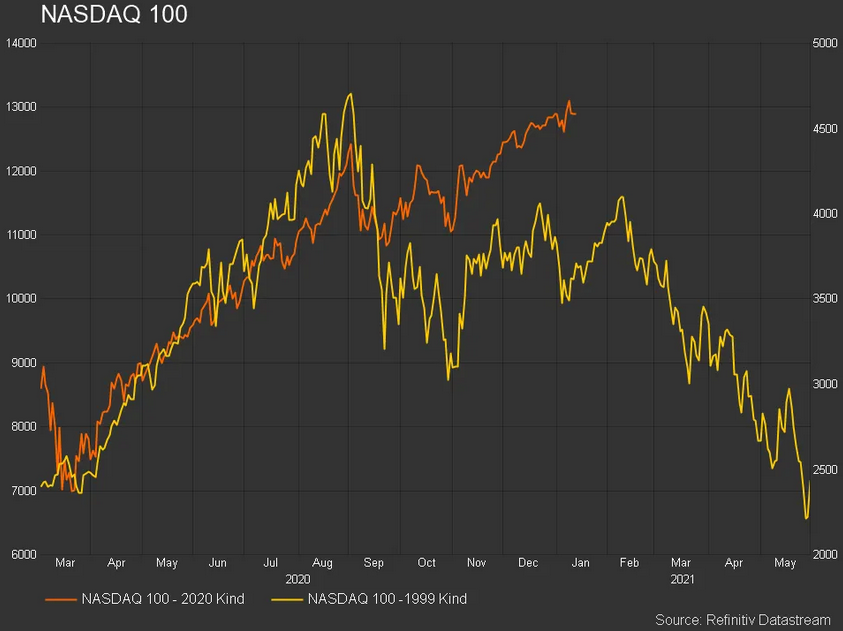
Nasdaq 100 Chart

Intel

Intel (NASDAQ:INTC) jumped today after it was announced that Bob Swan was stepping down as the CEO in February. The new CEO will be coming over from VMWare. Intel jumped rather noticeable, filling a technical gap from mid-July at $59.75. These CEO changes can be messy initially, so maybe the stock is getting ahead of itself here. At least, that is what the chart would indicate. Now it is going to have a gap to fill at $53.20.
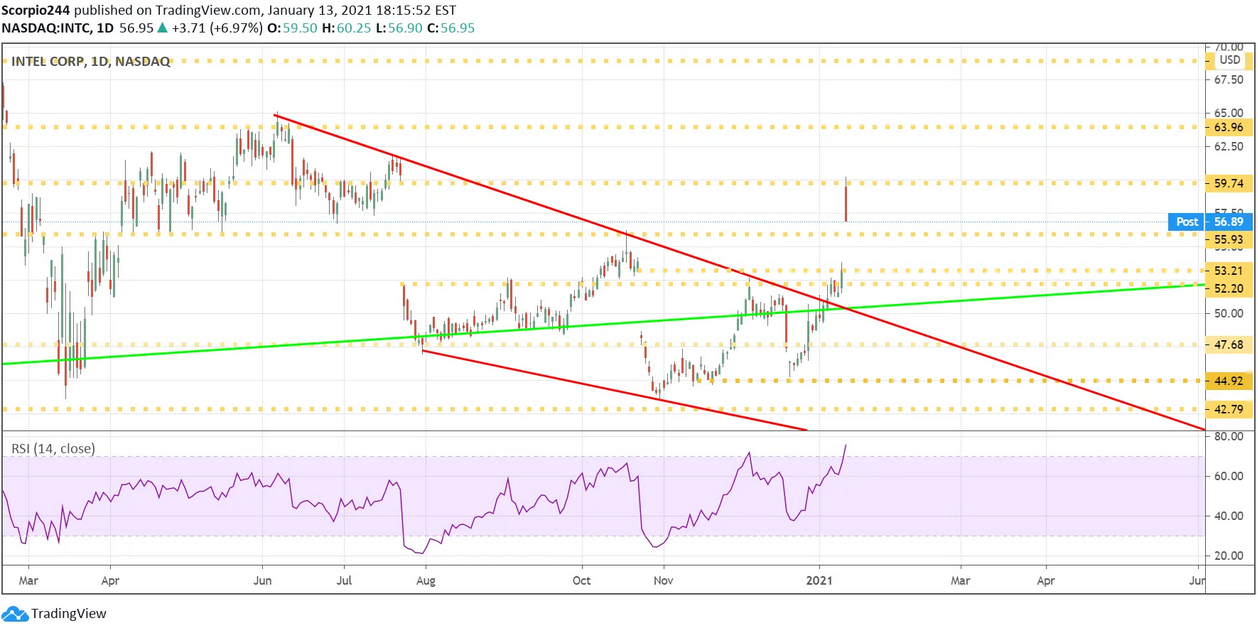
Intel Corp Daily Chart

AMD

Advanced Micro Devices (NASDAQ:AMD) didn’t like the Intel news falling by 3%. This stock seems to find a tremendous amount of support around $89.25. So that will be the level to watch. A breakdown could be a sign of a lot worse to come.
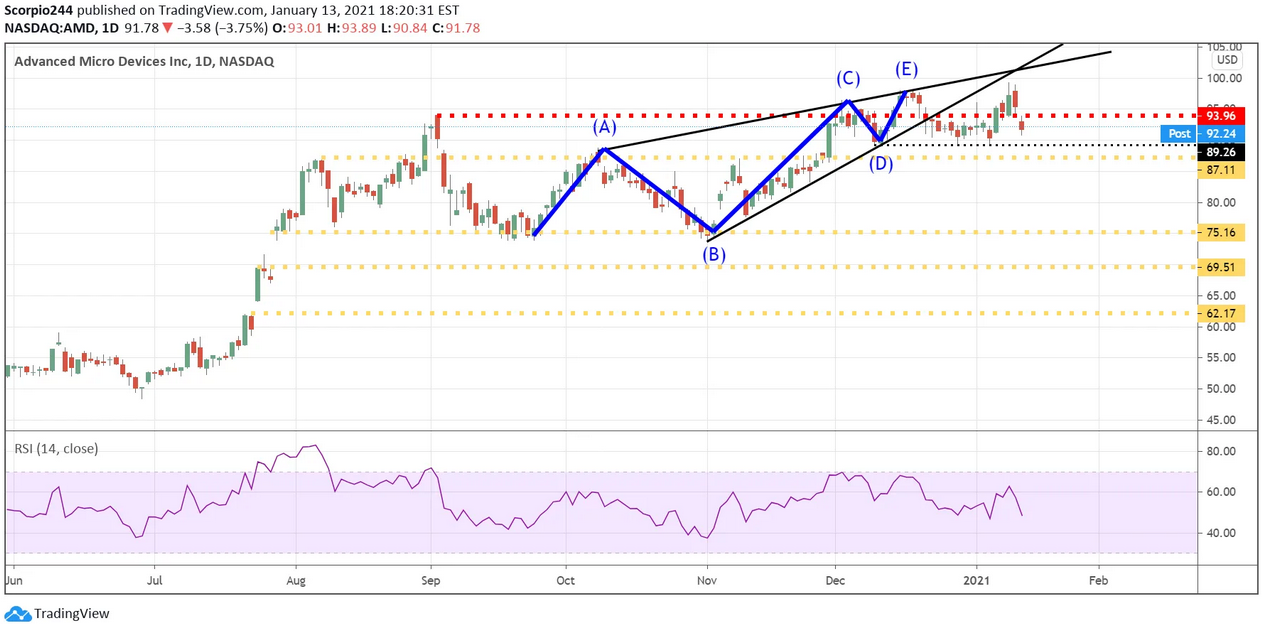
AMD Daily Chart

Exxon

Exxon Mobil (NYSE:XOM) keeps going up, and it is in a spot where it could even rise to around $51.
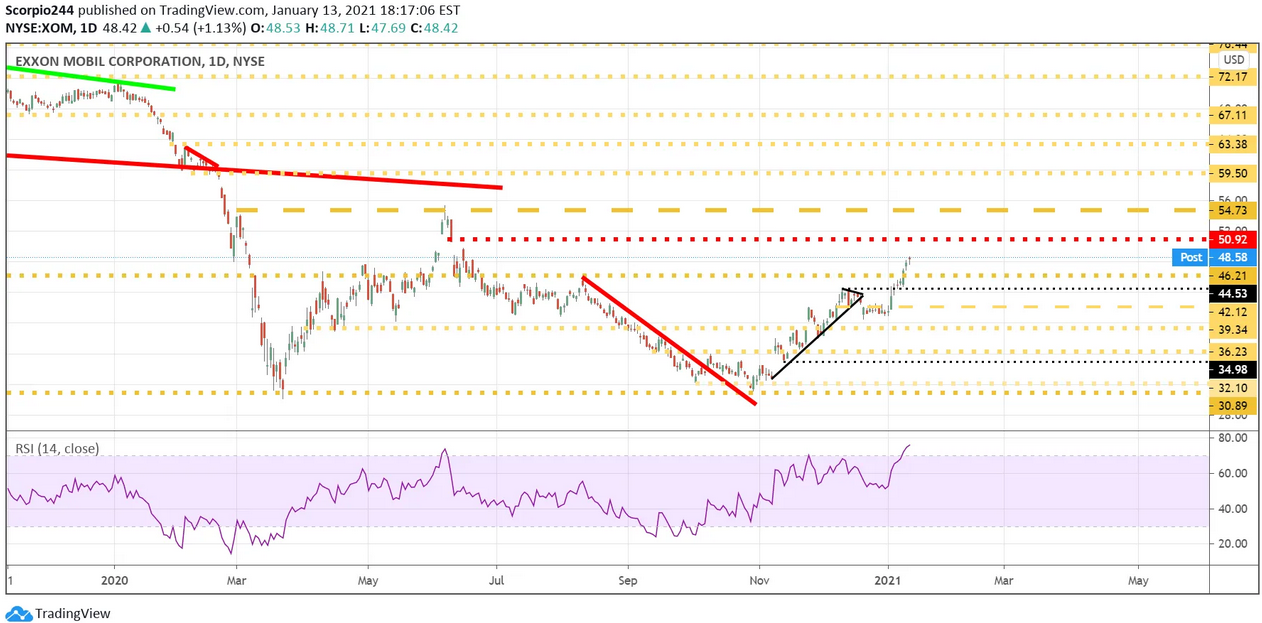
Exxon Mobil Corp Daily Chart

Original Post

Latest comments

Love the article! Interesting how vvix is diverging from vix
Risk Disclosure: Trading in financial instruments and/or cryptocurrencies involves high risks including the risk of losing some, or all, of your investment amount, and may not be suitable for all investors. Prices of cryptocurrencies are extremely volatile and may be affected by external factors such as financial, regulatory or political events. Trading on margin increases the financial risks.
Before deciding to trade in financial instrument or cryptocurrencies you should be fully informed of the risks and costs associated with trading the financial markets, carefully consider your investment objectives, level of experience, and risk appetite, and seek professional advice where needed.
Fusion Media would like to remind you that the data contained in this website is not necessarily real-time nor accurate. The data and prices on the website are not necessarily provided by any market or exchange, but may be provided by market makers, and so prices may not be accurate and may differ from the actual price at any given market, meaning prices are indicative and not appropriate for trading purposes. Fusion Media and any provider of the data contained in this website will not accept liability for any loss or damage as a result of your trading, or your reliance on the information contained within this website.
It is prohibited to use, store, reproduce, display, modify, transmit or distribute the data contained in this website without the explicit prior written permission of Fusion Media and/or the data provider. All intellectual property rights are reserved by the providers and/or the exchange providing the data contained in this website.
Fusion Media may be compensated by the advertisers that appear on the website, based on your interaction with the advertisements or advertisers.
© 2007-2024 - Fusion Media Limited. All Rights Reserved.