Whirlpool Corporation, (WHR) is trading $131.92, down 6.0% with IV30™ up 10.8%. The LIVEVOL® Pro Summary is below.
Whirlpool Corporation is a manufacturer and marketer of home appliances. Whirlpool operates in four segments: North America, Latin America, EMEA (Europe, Middle East and Africa) and Asia. Whirlpool manufactures and markets a line of home appliances and related products.
I found this stock using a real-time custom scan. This one hunts for elevated vols. But, this is also a stock note, as we’ve seen the stock hit an all-time (over a decade) high and recently dip hard off of that high. Further, the option market reflects greater risk in the coming week than it does from earnings (due out 10-22-2013 BMO). Hmm… Feels like a ticking clock that runs out on Friday.
Custom Scan Details
Stock Price GTE $5
IV30™ GTE 30
IV30™ Percentile GTE 80
Average Option Volume GTE 1,200
The two-year WHR Charts Tab is included (below). The top portion is the stock price; the bottom is the vol (IV30™ - red vs HV20™ - blue vs HV180™ - pink).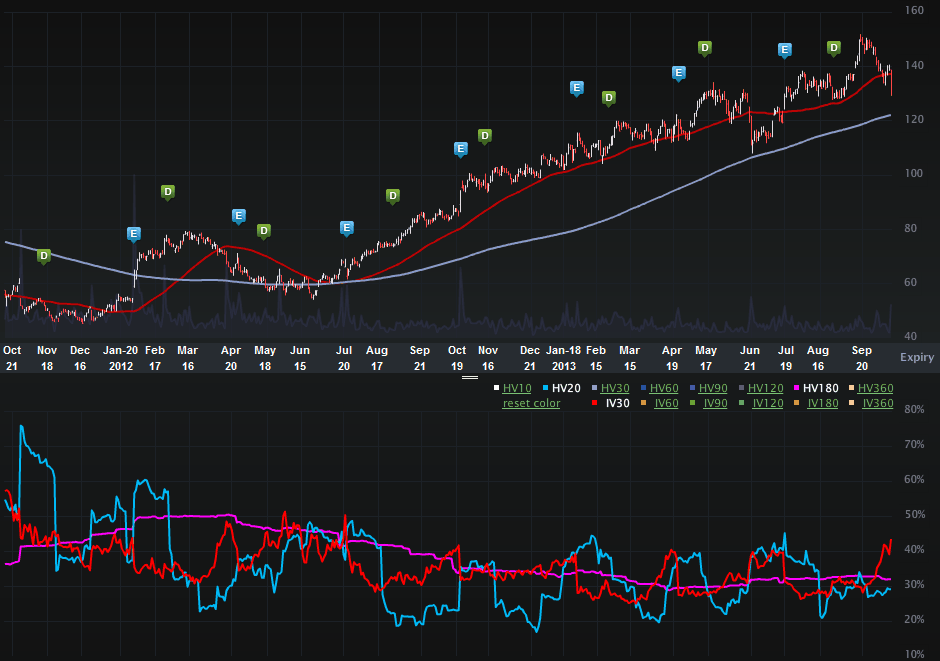
On the stock side we can see the meteoric rise from $54.98 two years ago to now over $130… The stock actually clipped the $150 level on 9-20-2013, which was an all-time high… and by all-time high, I mean, ALL-TIME HIGH. Check out this stock chart since WHR went public.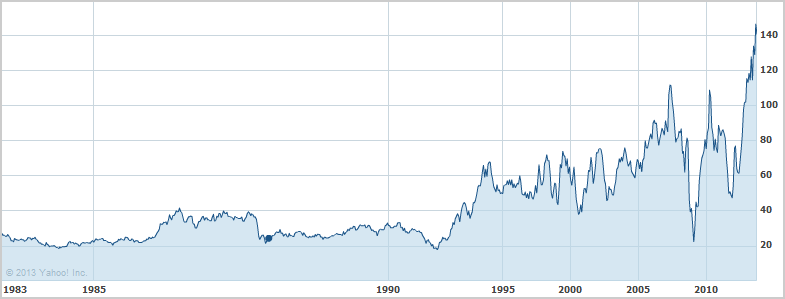
Provided by Yahoo! Finance
This stock chart goes back to 1983, so ~30 years. But from the two-year chart (above), we can also see the recent dip in stock price. The news today comes from a couple of boutique research shops which posted some warnings about sales growth for WHR and the stock is reacting to the downside fairly abruptly.
But, this is a volatility note, so let’s turn to the two-year IV30™ chart in isolation.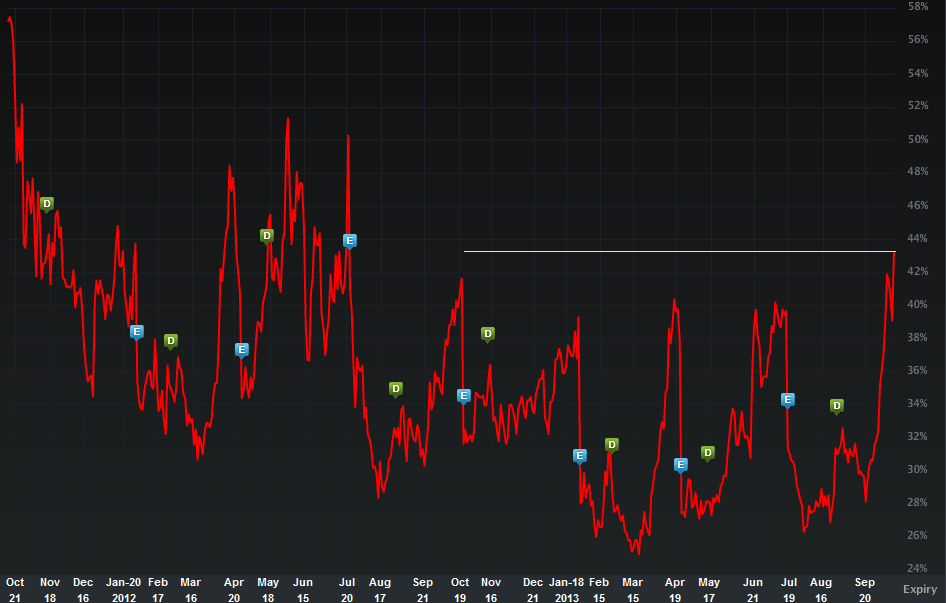
There are two phenomena that I want to draw our attention to:
(1) The IV30™ is at an annual high and by quite a large amount. That yellow line I’ve drawn in goes back one year, and we can see pretty clearly how elevated the vol is relative to any other level in the last 52 weeks.
(2) I also note the WHR has seen much higher volatility levels in the last two-years, reaching as high as 57%.
So what? Well, when you have a stock hitting an all-time 30 year high, then dipping off of some research notes and the implied hits an annual high, you do have to look further back and see, yes the volatility is elevated to the last year, but not for the full length of the stock rally. This stock could easily see IV30™ jump over the 60% mark if more research sales growth notes (or company press releases) pile on the idea of lower than expected revenue (and net Income). At this point, I would say, be careful, the option market reflects elevated risk but it could go higher and the stock has gone up a lot over the last two-years – a retracement isn’t an impossibility (nor is it a forgone conclusion).
Let’s turn to the Skew Tab.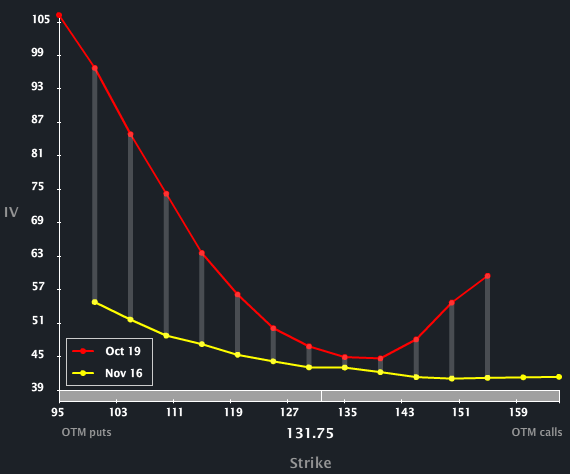
I note the parabolic skew in the very short-term (this week), reflecting both upside and downside risk. The Nov options however do not show this parabolic shape, rather they show a more normal one-sided (down side) skew.
Finally, let's look to the Options Tab (below).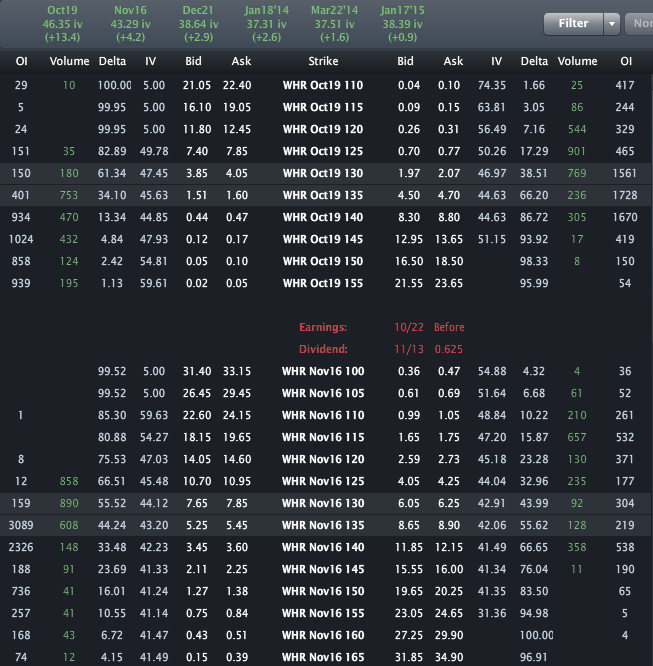
Across the top we can see the monthly vols are priced to 46.35% for Oct and 43.29% for Nov. Here’s the oddity, and it’s big, Nov expiry has the earnings release but shows lower vol than Oct. In English, the option market reflects greater risk in the coming week than it does from earnings. Hmm…
This is trade analysis, not a recommendation.
Disclosure: This is trade analysis, not a recommendation.
Images provided by Livevol®
- English (UK)
- English (India)
- English (Canada)
- English (Australia)
- English (South Africa)
- English (Philippines)
- English (Nigeria)
- Deutsch
- Español (España)
- Español (México)
- Français
- Italiano
- Nederlands
- Português (Portugal)
- Polski
- Português (Brasil)
- Русский
- Türkçe
- العربية
- Ελληνικά
- Svenska
- Suomi
- עברית
- 日本語
- 한국어
- 简体中文
- 繁體中文
- Bahasa Indonesia
- Bahasa Melayu
- ไทย
- Tiếng Việt
- हिंदी
Whirlpool Explodes To 30-Year Highs, Then Dips
Published 10/15/2013, 02:06 AM
Updated 07/09/2023, 06:31 AM
Whirlpool Explodes To 30-Year Highs, Then Dips
3rd party Ad. Not an offer or recommendation by Investing.com. See disclosure here or
remove ads
.
Latest comments
Install Our App
Risk Disclosure: Trading in financial instruments and/or cryptocurrencies involves high risks including the risk of losing some, or all, of your investment amount, and may not be suitable for all investors. Prices of cryptocurrencies are extremely volatile and may be affected by external factors such as financial, regulatory or political events. Trading on margin increases the financial risks.
Before deciding to trade in financial instrument or cryptocurrencies you should be fully informed of the risks and costs associated with trading the financial markets, carefully consider your investment objectives, level of experience, and risk appetite, and seek professional advice where needed.
Fusion Media would like to remind you that the data contained in this website is not necessarily real-time nor accurate. The data and prices on the website are not necessarily provided by any market or exchange, but may be provided by market makers, and so prices may not be accurate and may differ from the actual price at any given market, meaning prices are indicative and not appropriate for trading purposes. Fusion Media and any provider of the data contained in this website will not accept liability for any loss or damage as a result of your trading, or your reliance on the information contained within this website.
It is prohibited to use, store, reproduce, display, modify, transmit or distribute the data contained in this website without the explicit prior written permission of Fusion Media and/or the data provider. All intellectual property rights are reserved by the providers and/or the exchange providing the data contained in this website.
Fusion Media may be compensated by the advertisers that appear on the website, based on your interaction with the advertisements or advertisers.
© 2007-2024 - Fusion Media Limited. All Rights Reserved.
