I haven’t written a lot lately. Mostly I guess because there doesn’t seem to be a lot new to say. As you can see in Figure 1, the major market indexes are in an uptrend. All 4 (Dow, S&P 500, Russell 2000 and Nasdaq 100) are above their respective 200-day MA’s and all but Russell 2000 have made new all-time highs.
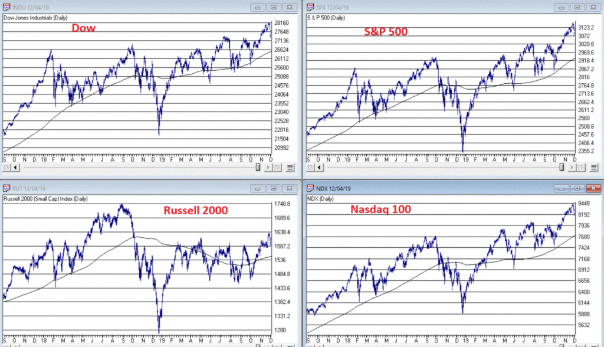
Figure 1 – 4 Major Market Indexes (Courtesy AIQ TradingExpert)
As you can see in Figure 2, my market “bellwethers” are still slightly mixed. Semiconductors are above their 200-day MA and have broken out to a new high, Transports and the Value Line Index (a broad measure of the stock market) are holding above their 200-day MA’s but are well off all-time highs, and the inverse VIX ETF ticker ZIV is in a downtrend (ideally it should trend higher with the overall stock market).
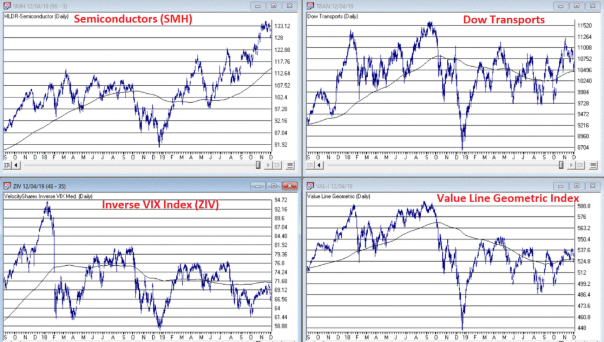
Figure 2 – Jay’s 4 Market “Bellwethers” (Courtesy AIQ TradingExpert)
As you can see in Figure 3, Gold, Bonds and the U.S. Dollar are still holding in uptrends above their respective 200-day MA’s (although all have backed off of recent highs) and crude oil is sort of “nowhere”.
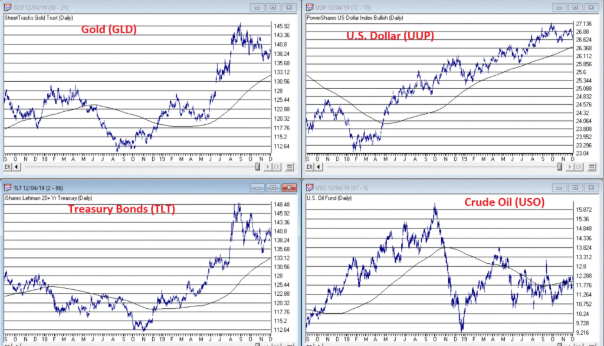
Figure 3 – Gold, Bonds, U.S. Dollar and Crude Oil (Courtesy AIQ TradingExpert)
Like I said, nothing has really changed. So, at this point the real battle is that age-old conundrum of “Patience versus Complacency”. When the overall trend is clearly “Up” typically the best thing to do is essentially “nothing” (assuming you are already invested in the market). At the same time, the danger of extrapolating the current “good times” ad infinitum into the future always lurks nearby.
What we don’t want to see is:
*The major market averages breaking back down below their 200-day MA’s.
What we would like to see is:
*The Transports and the Value Line Index break out to new highs (this would be bullish confirmation rather the current potentially bearish divergence)
The Importance of New Highs in the Value Line Index
One development that would provide bullish confirmation for the stock market would be if the Value Line Geometric Index were to rally to a new 12-month high. It tends to be a bullish sign when this index reaches a new 12-month high after not having done so for at least 12-months.
Figure 4 displays the cumulative growth for the index for all trading days within 18 months of the first 12-month new high after at least 12-months without one.
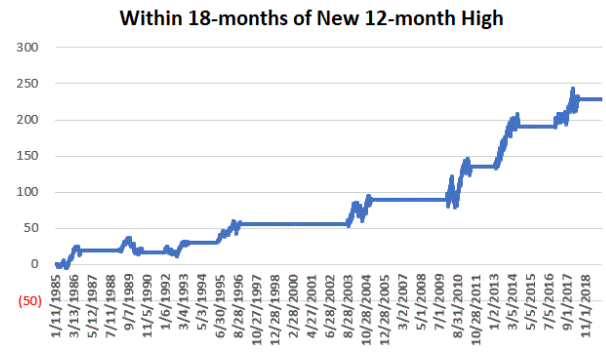
Figure 4 – Cumulative growth for Value Line Geometric Index within 18-months of a new 12-month high
Figure 5 – Cumulative growth for Value Line Geometric Index during all other trading days
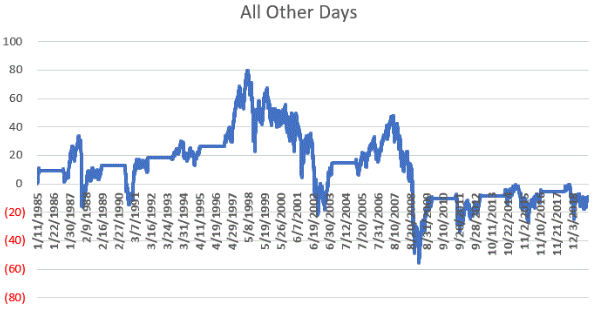
In Figure 4 we see that a bullish development (the first 12-month new high in at least 12 months) is typically followed by more bullish developments. In Figure 5 we see that all other trading days essentially amount to nothing.
Figure 6 displays the Value Line Geometric Index with the relevant new highs highlighted.
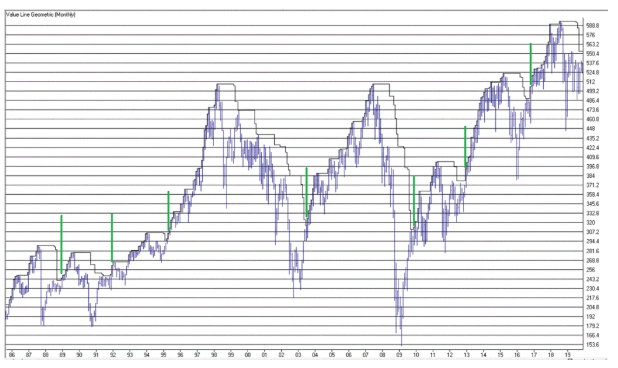
Figure 6 – Value Line Geometric Index (Courtesy AIQ TradingExpert)
Summary
The trend at this very moment is “Up.” So sit back, relax and enjoy the ride. Just don’t ever forget that the ride WILL NOT last forever. If the Value Line Geometric Index (and also the Russell 2000 and the Dow Transports) joins the party then history suggests the party will be extended. If they don’t, the party may end sooner than expected.
So pay attention.
