Investors have been turning over every rock they can find in the search for yield, causing the high yield space to be booming as of late. 2012 saw a record amount of high yield debt issued, beating out the previous record set just a few years prior in 2010. With Bernanke doing nearly all he can to suppress rates, fixed income investors are forced to continue walking further out on the risk curve.
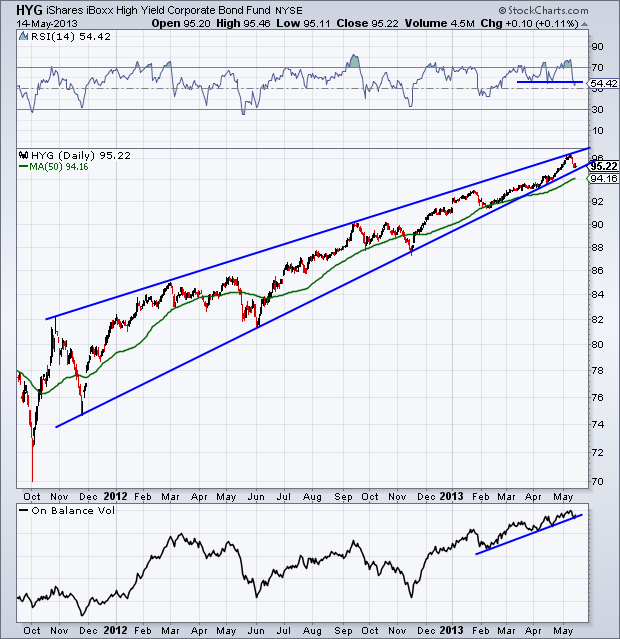
The iShares High Yield Corp. Bond ETF (HYG) is a popular vehicle for playing the high yield game. Going back to 2011 we can see that HYG has been in a fairly large triangle pattern. Typically the closer we get to an apex in this type of pattern the less ‘explosive’ the breakout is, but that doesn’t mean a large move in either direction is out of the question.
Momentum (RSI indicator) has been bullish during 2013, finding support at 55 and has been testing this level over the past couple of days. We can also see that bullish volume has been keeping the On Balance Volume (OBV) indicator rising – a sign that buyers continue to step in to move prices higher. Combining the support in RSI, the trend line on OBV and the support line of the triangle on price action we can get a clearer picture if we see a breakdown in the coming days/weeks if HYG begins to lose its luster.
To continue the theme of a frothy high yield market, Bespoke put out an interesting piece comparing high yield to Treasury debt:
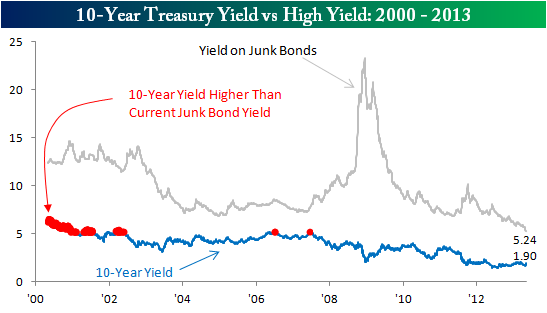
The chart below is from last week’s Bespoke Report newsletter, and it shows the average yield to maturity on the Merrill Lynch High Yield (Junk) Master Index. At a current level of 5.24%, investors have never been paid less to own high yield debt. Yields are so low, in fact, that five years ago the yield on the 10-Year US Treasury was higher than the current yield on junk bonds. In the chart below, the red dots on the blue line represent periods going back to 2000 where the yield on the 10-year US Treasury was higher than the current yield on the High Yield Master Index. With yields this low, high yield bonds are anything but high yielding. 
Disclaimer: Do not construe anything written in this post or this blog in its entirety as a recommendation, research, or an offer to buy or sell any securities. Everything in this post is meant for educational and entertainment purposes only. I or my affiliates may hold positions in securities mentioned in the blog. Please see my Disclosure page for full disclaimer.
- English (UK)
- English (India)
- English (Canada)
- English (Australia)
- English (South Africa)
- English (Philippines)
- English (Nigeria)
- Deutsch
- Español (España)
- Español (México)
- Français
- Italiano
- Nederlands
- Português (Portugal)
- Polski
- Português (Brasil)
- Русский
- Türkçe
- العربية
- Ελληνικά
- Svenska
- Suomi
- עברית
- 日本語
- 한국어
- 简体中文
- 繁體中文
- Bahasa Indonesia
- Bahasa Melayu
- ไทย
- Tiếng Việt
- हिंदी
Where Could High Yield Be Heading?
Published 05/16/2013, 12:50 AM
Updated 07/09/2023, 06:31 AM
Where Could High Yield Be Heading?
Latest comments
Loading next article…
Install Our App
Risk Disclosure: Trading in financial instruments and/or cryptocurrencies involves high risks including the risk of losing some, or all, of your investment amount, and may not be suitable for all investors. Prices of cryptocurrencies are extremely volatile and may be affected by external factors such as financial, regulatory or political events. Trading on margin increases the financial risks.
Before deciding to trade in financial instrument or cryptocurrencies you should be fully informed of the risks and costs associated with trading the financial markets, carefully consider your investment objectives, level of experience, and risk appetite, and seek professional advice where needed.
Fusion Media would like to remind you that the data contained in this website is not necessarily real-time nor accurate. The data and prices on the website are not necessarily provided by any market or exchange, but may be provided by market makers, and so prices may not be accurate and may differ from the actual price at any given market, meaning prices are indicative and not appropriate for trading purposes. Fusion Media and any provider of the data contained in this website will not accept liability for any loss or damage as a result of your trading, or your reliance on the information contained within this website.
It is prohibited to use, store, reproduce, display, modify, transmit or distribute the data contained in this website without the explicit prior written permission of Fusion Media and/or the data provider. All intellectual property rights are reserved by the providers and/or the exchange providing the data contained in this website.
Fusion Media may be compensated by the advertisers that appear on the website, based on your interaction with the advertisements or advertisers.
© 2007-2024 - Fusion Media Limited. All Rights Reserved.
