As US equity markets continue to recover from their recent battering, I thought it was time to check out some of the stocks I’ve covered in the last few weeks, and in particular Amazon (NASDAQ:AMZN), Boeing (NYSE:BA), General Electric Company (NYSE:GE) and finally McDonald’s Corporation (NYSE:MCD).
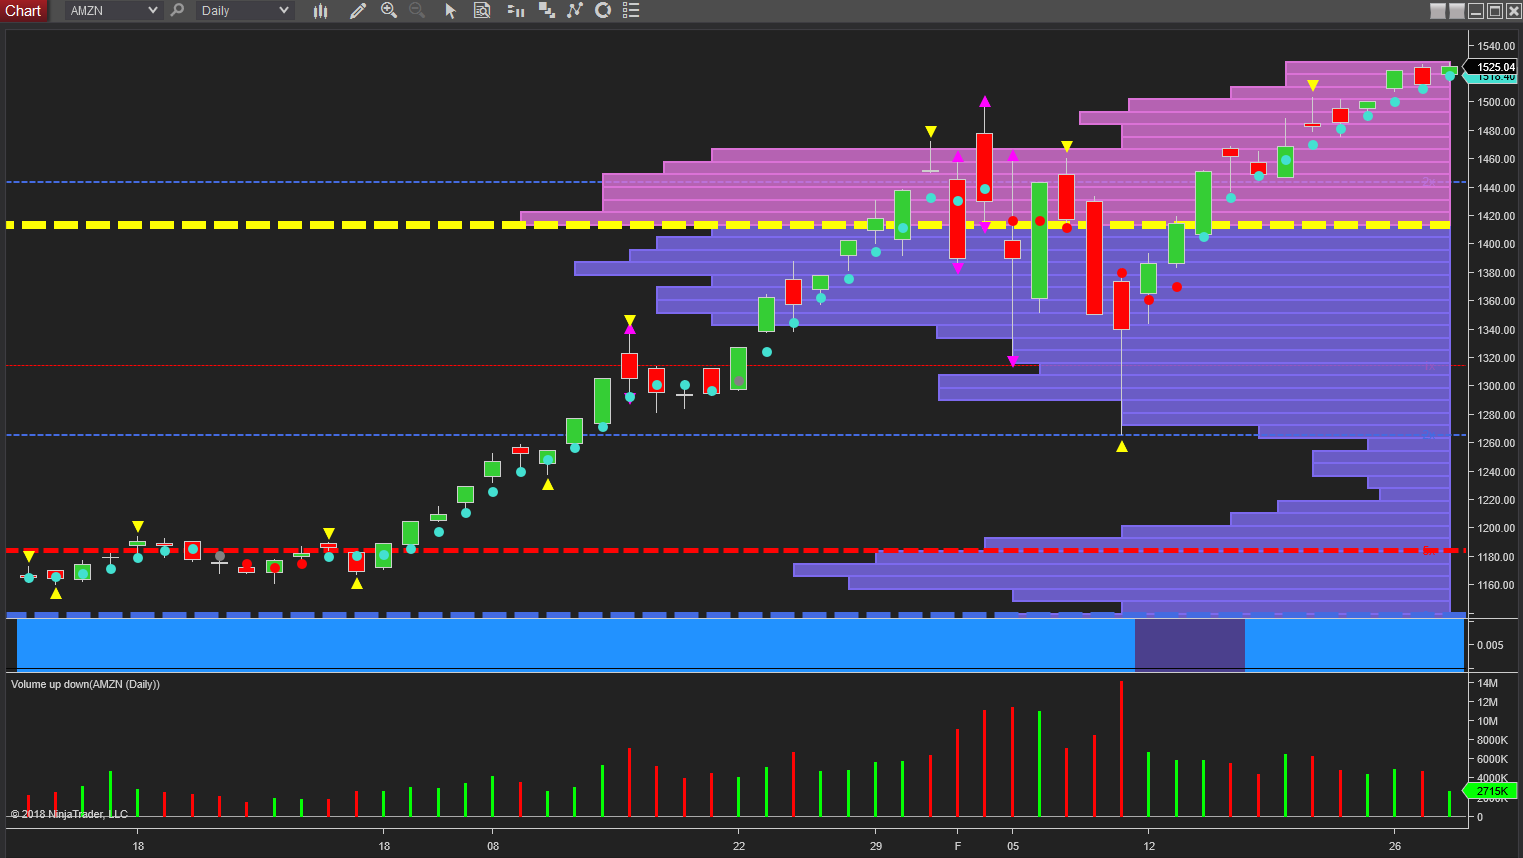
And if we begin with Amazon, the stock has continued higher and taken out the $1500 price level as suggested, and is currently trading at $1524.23 at the time of writing. Bullish momentum remains firmly in place for the being as we continue to move firmly away from the volume point of control which sits at the $1415 region. The move higher is on good good volume as Amazon approachs a low volume node in the journey higher, with the trend monitor also remaining firmly blue.

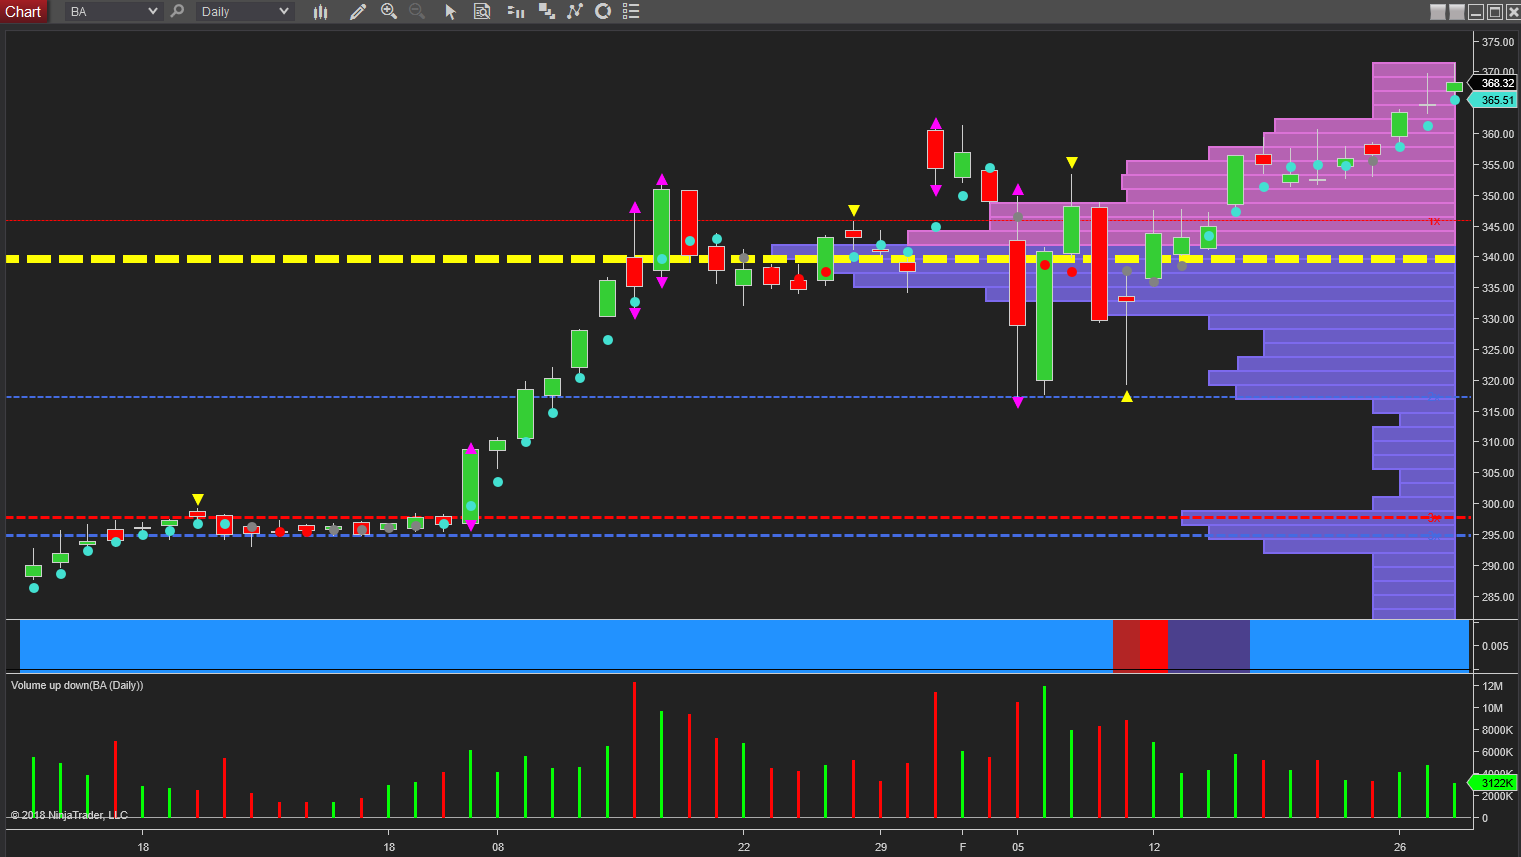
If we move to Boeing, this is another stock sending some strong signals of bullish momentum, but as I wrote at the time was also experiencing some bumpy conditions in the $355 area on the daily chart. Since then the upwards trend has been re-established, and with a solid platform of support now in place below together with the volume point of control, Boeing looks set to continue higher in the short to medium term.

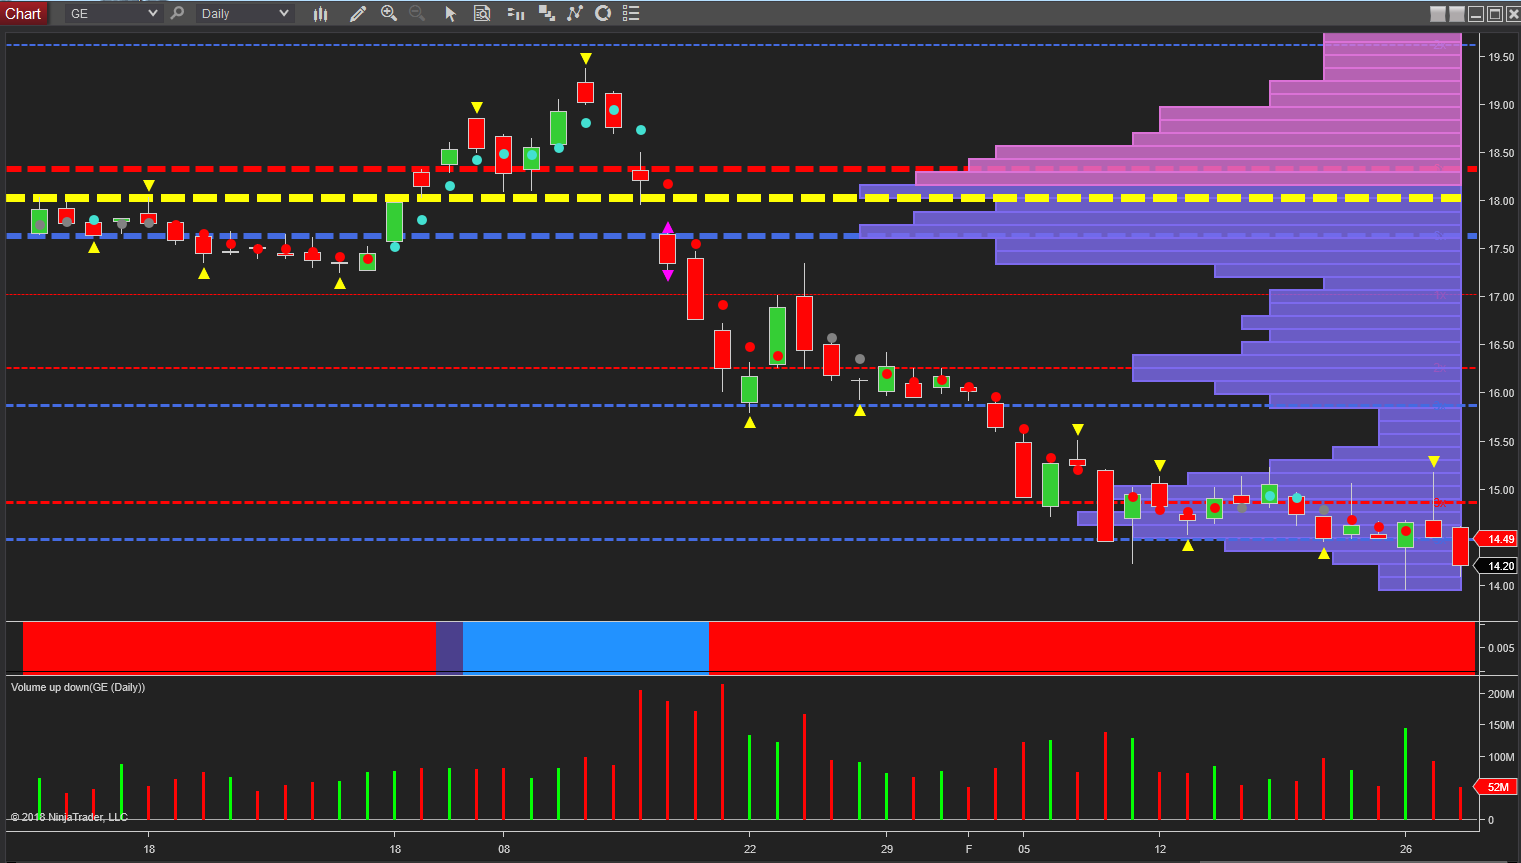
Next comes GE, and here the story is the polar opposite with bearish sentiment continuing to remain dominant, with today’s wide spread down candle suggesting we are likely to see a further leg down for this stock in the near future. Monday’s candle hinted at some short term buying, but this was snuffed out by yesterday’s weak attempt to rally on good volume, with the deep upper wick to the candle telling its own story. This weakness has carried through into today’s trading session, and any move through the $14 area is likely to be the precursor to an even deeper move lower, and one that could ultimately see GE move into single figures in the longer term. As always volume will reveal the truth behind the numbers, and for any meaningful recovery in this stock we will need to see sustained buying volume prior to any longer term rally.

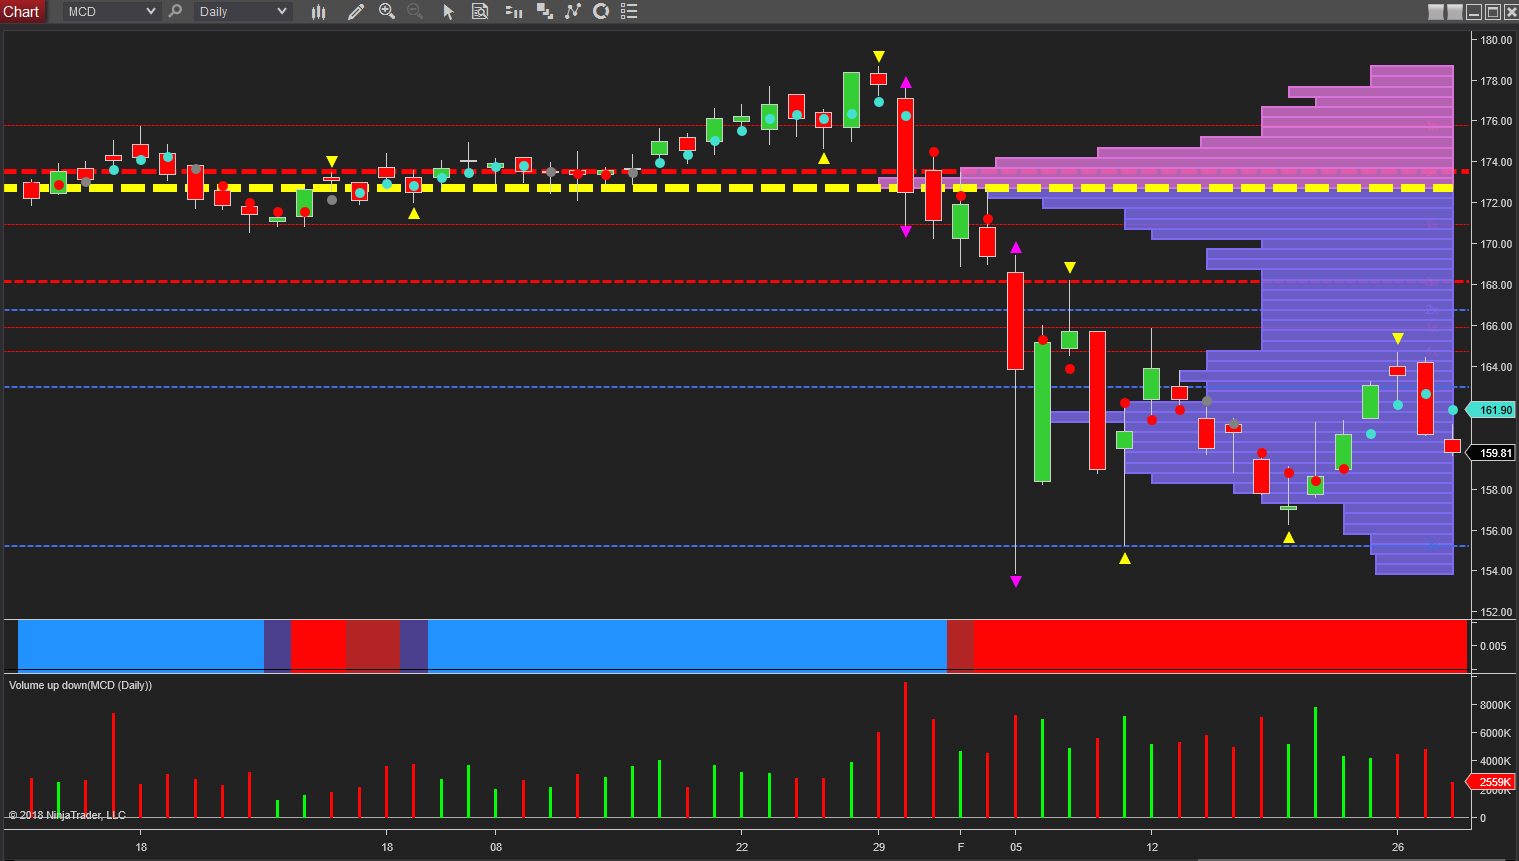
Finally to McDonalds, another stock that remains very bearish and notice in particular the rally of last week where we saw rising prices on falling volume, a sure sign of further weakness which has duly arrived this week. For MCD stock, the key price level is now in the $156 area below, and should this be taken out on good volume, a deeper move may develop longer term. Note the pivot high on Monday’s candle, and with the volume point of control overhead in the $172.80 area, this is adding further downwards pressure with the trend monitor also remaining firmly red.
