
In the private markets, buyers and sellers care a great deal about valuation. For example, a financial advisory practice might fetch between 1 percent and 2 percent of assets under management. Or it might go for 2.3 times trailing 12 months’ gross revenues. Higher or lower valuations depend largely on things like key personnel, average account size, client retention, economies of scale and the growth rate.
The critical importance of valuation also comes to light on the popular television show, “Shark Tank.” Having already placed a value on their respective companies, entrepreneurs approach business titans to pitch their products and services. An entrepreneur may want $500,000 for a 25% stake, implying that he/she believes that the company is worth $2 million. Personalities like Mark Cuban and Kevin O’Leary (a.k.a. “sharks”) might not agree. Perhaps one of them might offer $325,000 for a 50% stake, placing the value at $650,000.
In the public marketplace, buyers should care about the price they are paying for S&P 500 corporations. At this moment in time, though, they care little about the price they are paying.
On virtually any methodology one employs, the U.S. stock market is extremely overpriced. Other than the tech bubble’s brief insanity in early 2000, one would be hard-pressed to find circumstances when stock prices were more euphoric than right now in 2018.

In fact, there are other measures that show that the market is every bit as bad as it was in 2000. For instance, Geoffrey Caveney demonstrated that the median price-to-free-cash-flow (P/FCF) for the S&P 500 SPDR Trust (SPY (NYSE:SPY)) is roughly 35. That means investors who acquire U.S. stocks at present-day prices are accepting the market at approximately 35 years worth of free cash flow.
Corporations may be able to manipulate bottom-line earnings results, but they cannot feign an ability to generate cash. It follows that a P/FCF ratio of 35 shows that the S&P 500 is trading at exorbitant levels not unlike the tech bubble in 2000; specifically, S&P 500 companies in aggregate are not generating enough free cash flow to support the multiple.
Like free cash flow, it’s far more difficult to fake revenue than it is to fake earnings. Is it any surprise that the price-to-sales (P/S) ratio is higher than it was in 2000? What about the fact that the median S&P 500 stock’s price-to-sales ratio is more than twice the level witnessed during the tech bubble?

We could also look at the Warren Buffett indicator, market-cap-to-GDP. The Oracle of Omaha famously said that the indicator “…is probably the best single measure of where valuations stand at any given moment.” And with good reason. Market-cap-to-GDP boasts an exceptionally high correlation with future stock market return.
At present, market-cap-to-GDP may be suggesting that stocks in 2000 and stocks in 2018 are quite similar. Granted, Buffett himself has downplayed the significance of the measure in recent years. Nevertheless, should value conscious investors simply ignore the weight of the aggregate evidence because U.S. stocks continue to defy traditional and non-traditional valuation?

Speaking of non-traditional valuation, I recently came across a unique way of identifying whether or not stocks are richly priced, fairly priced or under-priced. Gray Emerson Cardiff, editor of the Sound Advice newsletter, developed an index comparing the S&P 500 to median new home prices. And he has data going back to the 1800s.
In particular, the index has popped above 2.0 on only five other occasions in the last 120 years. Each occasion, the pinnacle was followed by a bearish stock market outcome.

What is particularly intriguing about the measure is that median new home prices are also at all-time record highs. Residential real estate may not be severely overvalued, but it is hardly a bargain either.
On the other five occasions — 1906, 1928, 1937, 1965, 1998 — 50% stock price decimation came to pass shortly thereafter. Cardiff went onto explain that stock prices may remain elevated for months or years after a sell signal. Nevertheless, a price collapse or crash has always resulted.
There are those who will dismiss valuations outright. Others may parrot something about low interest rates. Still others will describe prices being reasonable relative to forward 12-months earnings prospects. Apparently, some folks are unaware how detrimental 12-month earnings prospects were for those who relied on them on January 1, 2000 and January 1, 2008.
Consider January of 2008. Wall Street’s major firms forecasted year-end S&P 500 earnings of $97 and an average December 31st price target of 1640. The S&P 500 actually earned $50 and the S&P 500 actually closed out 2008 at 903.
It should also be noted that forward 12-month P/E ratios have one of the weakest correlations with 10-year future returns of any of the valuations methodologies. It is one thing if an investor willingly chooses to eschew valuation, opts to buy an S&P 500 exchange-traded index fund regardless of price, and hopes that holding for decades will prove beneficial. It is quite another to pretend that forward “guestimates” are flashing a buy signal at today’s prices.
Truth be told, valuations have not mattered for the public markets for at least three-and-a-half years. It is also true that negative rate monetary policy (adjusted for inflation) has been a tremendous tailwind for stock price appreciation, as have the corporate tax cuts.
Regardless, valuations will matter again, and it isn’t going to take another three-and-a-half years. The combination of Federal Reserve balance sheet reduction and overnight lending rate increases will lead to higher borrowing costs and/or a significant economic slowdown.
Higher borrowing costs are already having an adverse effect on real estate. Pending home sales are down for seven consecutive months. Inventory has been rising. And home price appreciation has been plateauing. Indeed, it appears that homebuilder stocks have been sniffing out the affordability quagmire.

Meanwhile, Federal Reserve voting members understand that past recessions required the institution to reduce overnight lending rates by 500 basis points (5%). With the Fed Funds rate below 2%, they have to push the Fed Funds rate higher in a “strong economy” to have an ability to respond to an economic downturn in the future.
The Fed, then, is forced to slow the economy to be positioned to support the economy in the next recession. Ironic, yes. In essence, in much the same way that the central bank of the United States contributed to the 2000-2001 recession and 2008-2009 Great Recession, the Fed will likely contribute to the next one.
How long until the next one? If history is any guide, 6-24 months from the time the Fed’s actions lead to the inversion of the yield curve. The way things are going, with 21 basis points separating 10-year Treasuries from 2-Year Treasuries, an inverted yield curve might happen in the next few months.

Some advocate shifting toward more defensive stocks like utilities and consumer staples. That may help a bit. However, if you are a retiree or near-retiree, you may not have the luxury of riding out a storm that hits risk assets clear across the board.
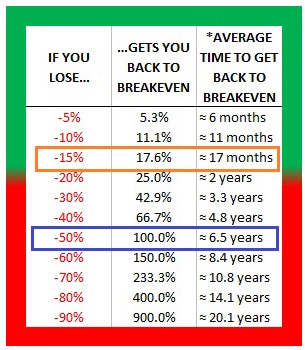
Having some money in cash equivalents that yield 2%-2.4% would help a retiree when he/she is already withdrawing income from a nest egg. Investment accounts recover quicker when they lose less value in a bearish stock retreat.
Disclosure Statement: ETF Expert is a web log (“blog”) that makes the world of ETFs easier to understand. Gary Gordon, MS, CFP is the president of Pacific Park Financial, Inc., a Registered Investment Adviser with the SEC. Gary Gordon, Pacific Park Financial, Inc., and/or its clients may hold positions in the ETFs, mutual funds, and/or any investment asset mentioned above. The commentary does not constitute individualized investment advice. The opinions offered herein are not personalized recommendations to buy, sell or hold securities. At times, issuers of exchange-traded products compensate Pacific Park Financial, Inc. or its subsidiaries for advertising at the ETF Expert website. ETF Expert content is created independently of any advertising relationship.