
Expedia Group, Inc. (NASDAQ:EXPE) is scheduled to report fourth-quarter 2018 results on Feb 7.
The company outpaced the Zacks Consensus Estimate in two of the trailing four quarters, delivering average positive earnings surprise of 16.18%.
In the last reported quarter, Expedia posted earnings of $3.65 per share, with the positive surprise being 20.74%. Further, the figure surged 45.4% on a year-over-year basis.
Revenues increased 13.9% sequentially and 10.4% on a year-over-year basis to $3.28 billion. However, the figure lagged the Zacks Consensus Estimate of $3.29 billion.
The top-line growth was driven by robust performance of HomeAway, Brand Expedia, Expedia Partner Solutions and Hotels.com. Further, improving stayed nights and expanding lodging portfolio drove the results.
Expedia continues to benefit from strong segmental performance, which will help the stock to rebound. Let’s see how things are shaping up for the upcoming quarterly results.
Core OTA
In the third quarter, revenues in the segment increased 9.1% year over year to $2.53 billion. Growing stayed room night number and overall gross bookings will continue to drive results in the segment. The Zacks Consensus Estimate for the segment’s revenues is currently pegged at $2.02 billion.
HomeAway
HomeAway revenues in the third quarter rallied 35% from the year-ago figure to $410 million. Rising conversion rates and strong focus on improvisation of instant book ability are anticipated to drive its top line in the soon-to-be-reported quarter. Further, a consistent increase in stayed room nights and property nights is likely to contribute to HomeAway listings in the fourth quarter. The Zacks Consensus Estimate for revenues is pegged at $247 million.
Egencia
Egencia revenues improved 10.3% on a year-over-year basis to $139 million in the third quarter. The segment is expected to perform well in the to-be-reported quarter as well, with the ramp up of Egencia's sales force and growing clientele. Further, Egencia’s offering of differentiated products will likely sustain momentum in the corporate travel market. This is also expected to drive the segment’s top line in the quarter to be reported. The Zacks Consensus Estimate for the segment’s revenues is pegged at $150 million.
Trivago
Although revenues from trivago fell 12.7% year over year to $295 million due to unfavorable changes in marketplaces, the company’s continued efforts to increase alternative accommodation listings on the trivago platform are expected to aid the top line. The Zacks Consensus Estimate for fourth-quarter revenues of the segment is pegged at $195 million.
What Our Model Says
According to the Zacks model, a company with a Zacks Rank #1 (Strong Buy), 2 (Buy) or 3 (Hold) has a good chance of beating estimates if it also has a positive Earnings ESP. That is not the case here as you will see below.
Expedia currently has a Zacks Rank #4 (Sell) and an Earnings ESP of +3.54%.
Sell-rated stocks (Zacks Rank #4 or 5) are best avoided. You can uncover the best stocks to buy or sell before they’re reported with our Earnings ESP Filter.
Expedia Group, Inc. Price and EPS Surprise
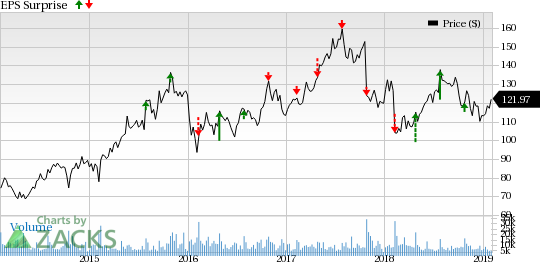
Expedia Group, Inc. Price and EPS Surprise | Expedia Group, Inc. Quote
Stocks That Warrant a Look
Here are a few stocks worth considering as our model shows that these have the right combination of elements to deliver an earnings beat in their upcoming releases.
Vipshop Holdings Limited (NYSE:VIPS) has an Earnings ESP of +5.26% and a Zacks Rank #2. You can see the complete list of today’s Zacks #1 Rank stocks here.
Square, Inc. (NYSE:SQ) has an Earnings ESP of +6.06% and a Zacks Rank #2.
Gogo Inc. (NASDAQ:GOGO) has an Earnings ESP of +9.46% and a Zacks Rank #2.
Today's Best Stocks from Zacks
Would you like to see the updated picks from our best market-beating strategies? From 2017 through 2018, while the S&P 500 gained +15.8%, five of our screens returned +38.0%, +61.3%, +61.6%, +68.1%, and +98.3%.
This outperformance has not just been a recent phenomenon. From 2000 – 2018, while the S&P averaged +4.8% per year, our top strategies averaged up to +56.2% per year.
See their latest picks free >>
Expedia Group, Inc. (EXPE): Get Free Report
Square, Inc. (SQ): Free Stock Analysis Report
Vipshop Holdings Limited (VIPS): Free Stock Analysis Report
Gogo Inc. (GOGO): Free Stock Analysis Report
Original post
Zacks Investment Research