
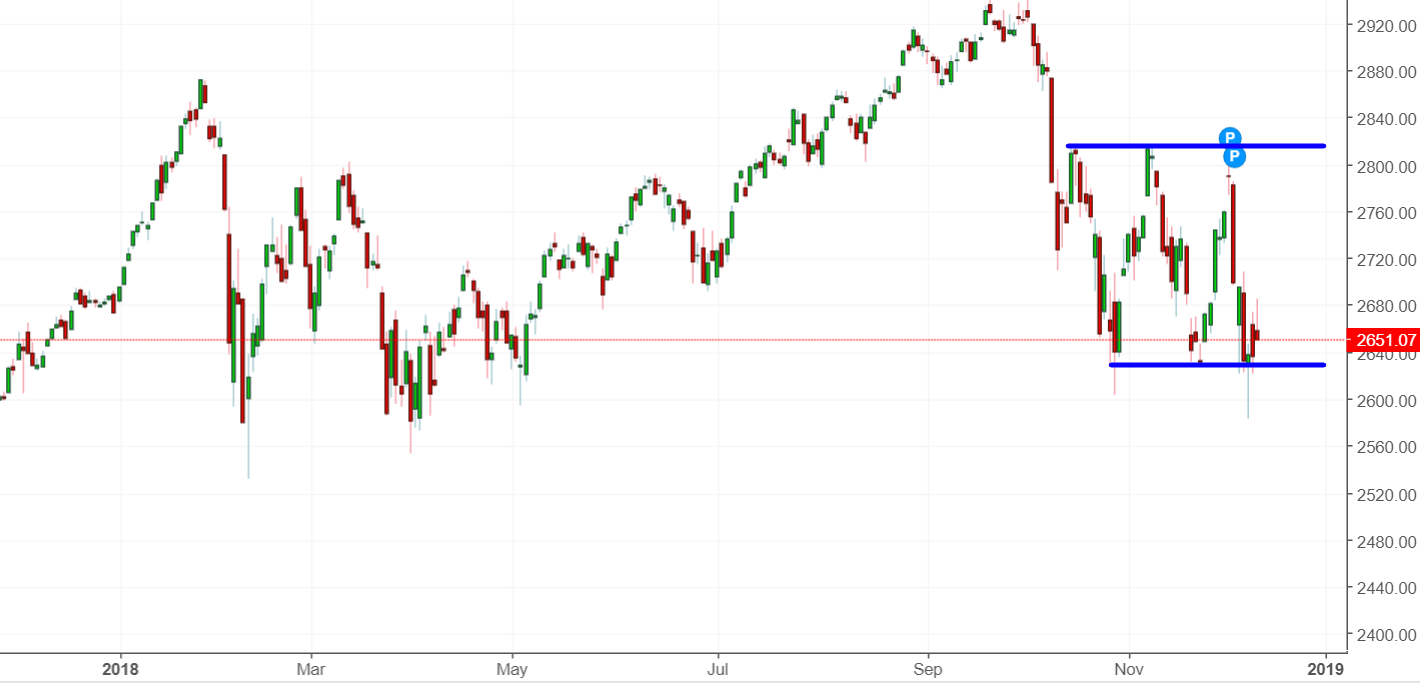
The U.S. stock market remains stuck in a range.
Go here to understand our fundamentals-driven long term outlook.
Let’s determine the stock market’s most probable medium term direction by objectively quantifying technical analysis. For reference, here’s the random probability of the U.S. stock market going up on any given day, week, or month.

*Probability ≠ certainty. Past performance ≠ future performance. But if you don’t use the past as a guide, you are walking blindly into the future.
Investment grade spreads are widening
Investment grade bond spreads have been rising since late-2017. In the past, investment grade spreads widened BEFORE equity bull markets topped.
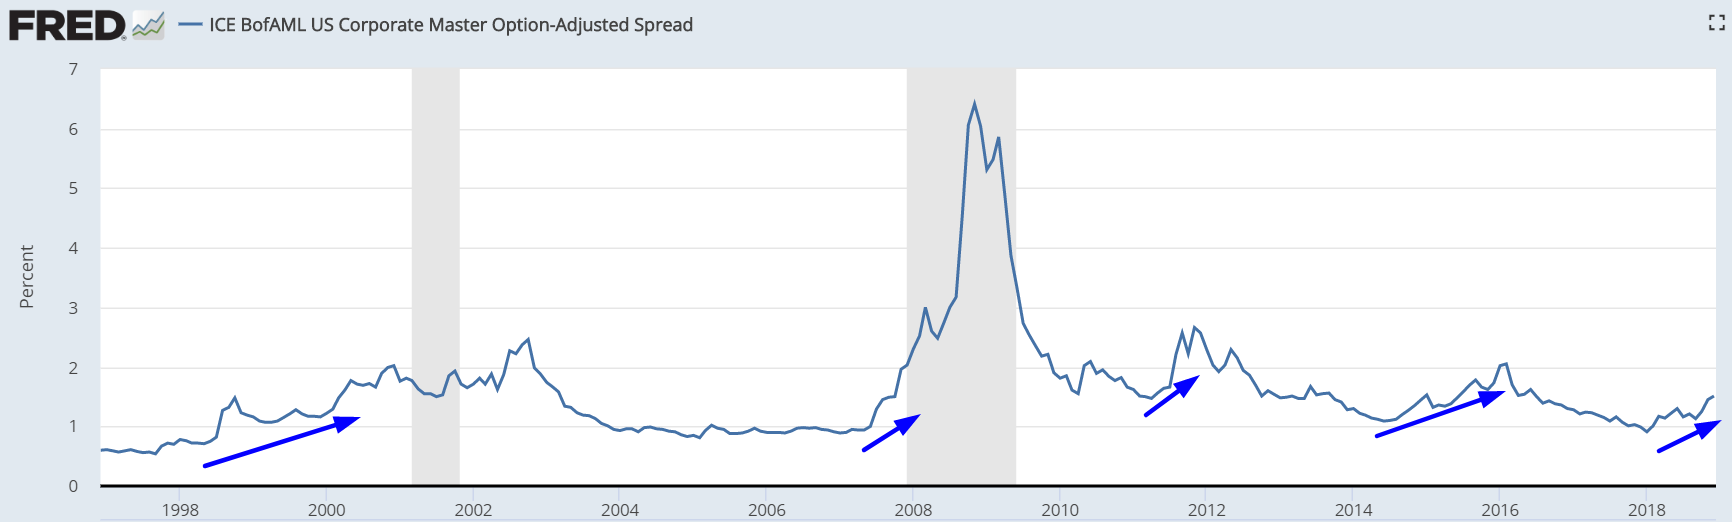
Interestingly enough, the S&P 500 is still positive on a year-over-year basis despite the current correction.
Here’s what happened next to the S&P 500 when investment grade spreads widened by more than 0.49% over the past year while the S&P 500 was still positive.
Let’s narrow down the sample size to see the first case in 3 months.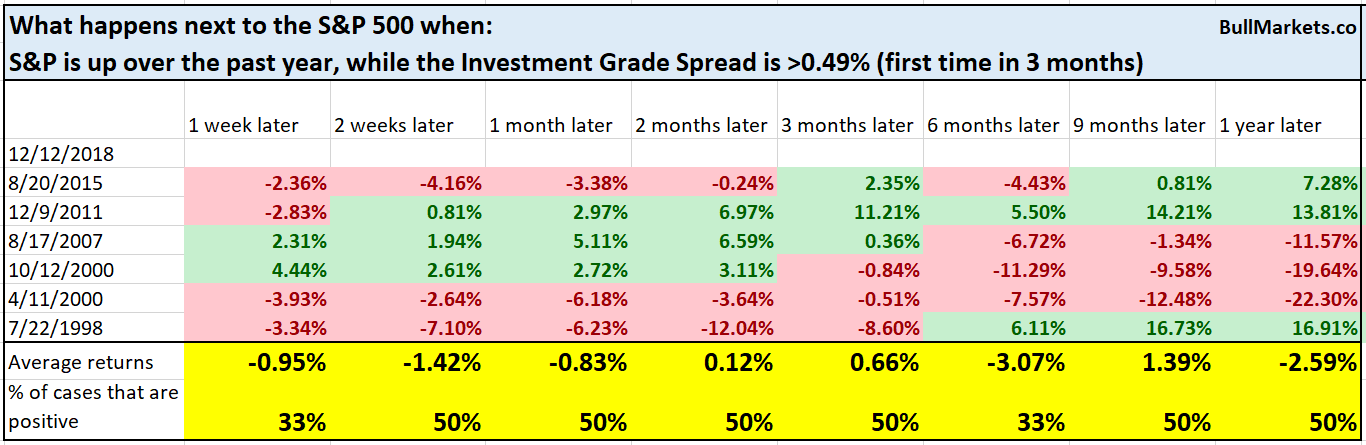
You can see that the stock market’s forward returns start to deteriorate 6 months later.
Financial sector weakness
The financial sector has been hammered this year, possibly due to the flatness of the yield curve. Here’s the KBW Bank

Here’s what happened next to the S&P 500 when BKX fell more than -20% to a 1 year low, while the S&P was within 10% of a 1 year high.
*Data from 1993 – present
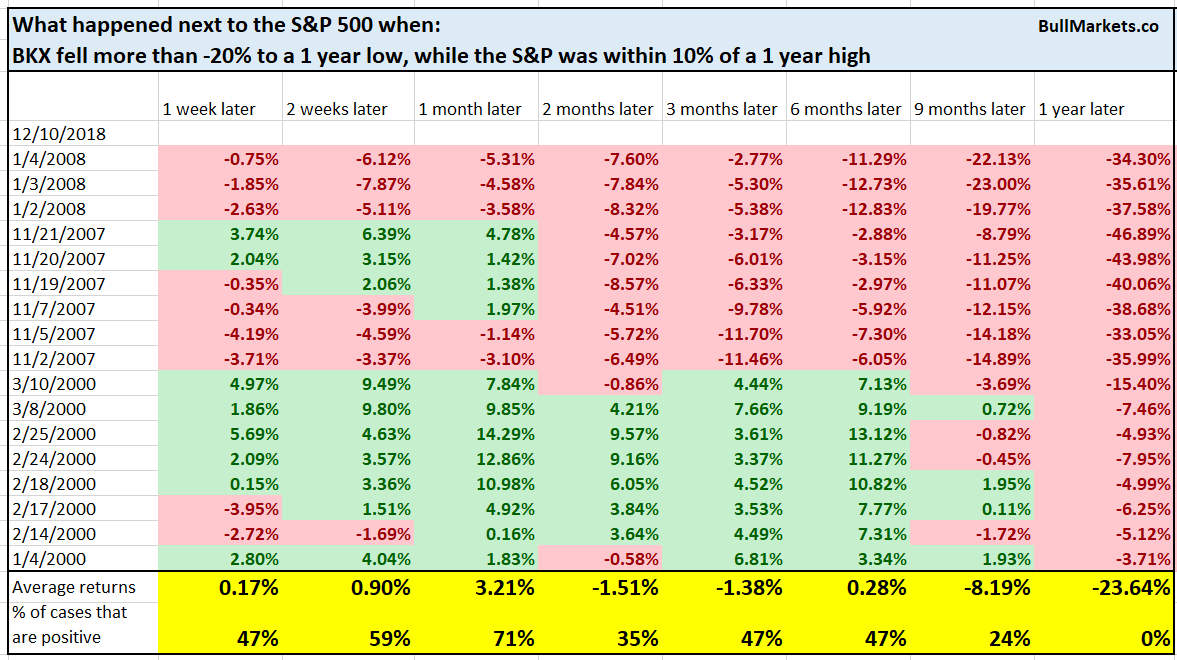
As you can see, there are really only 2 cases: 2000 and 2007. On average, the stock market was ok up until 6 months later, after which forward returns deteriorated significantly.
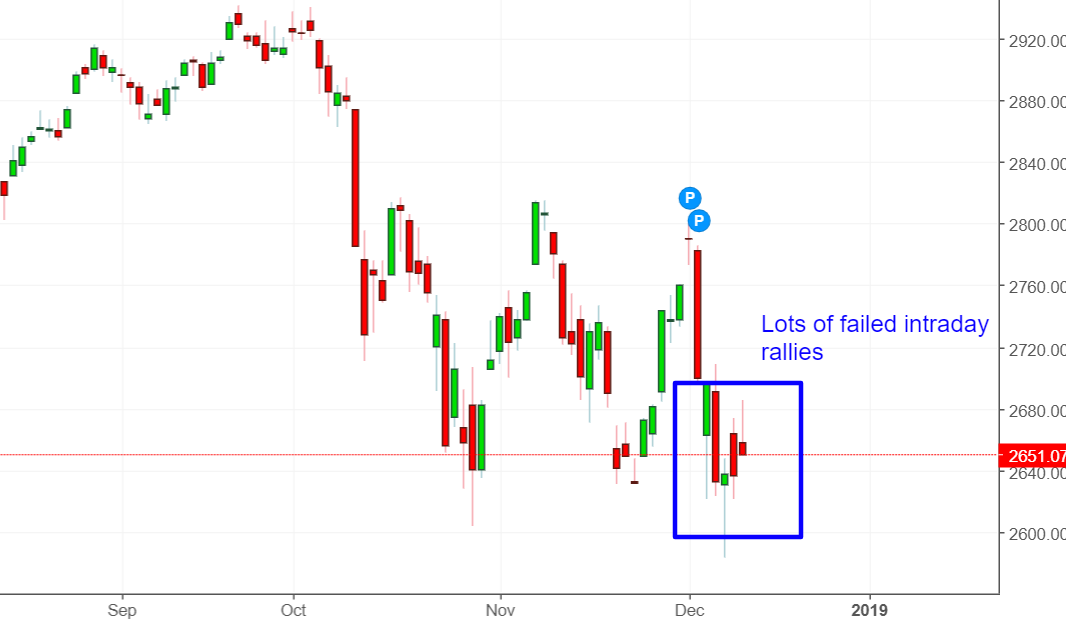
Failed rallies
Many of the stock market’s intraday rallies over the past week have failed, with the stock market falling in the later part of each day.
Is this a bear market symptom?
Here’s what happens next to the S&P 500 when there are 5 consecutive days in which the daily LOW is more than -1% below the daily OPEN, while the S&P was within 15% of a 1 year high.
*Data from 1962 – present
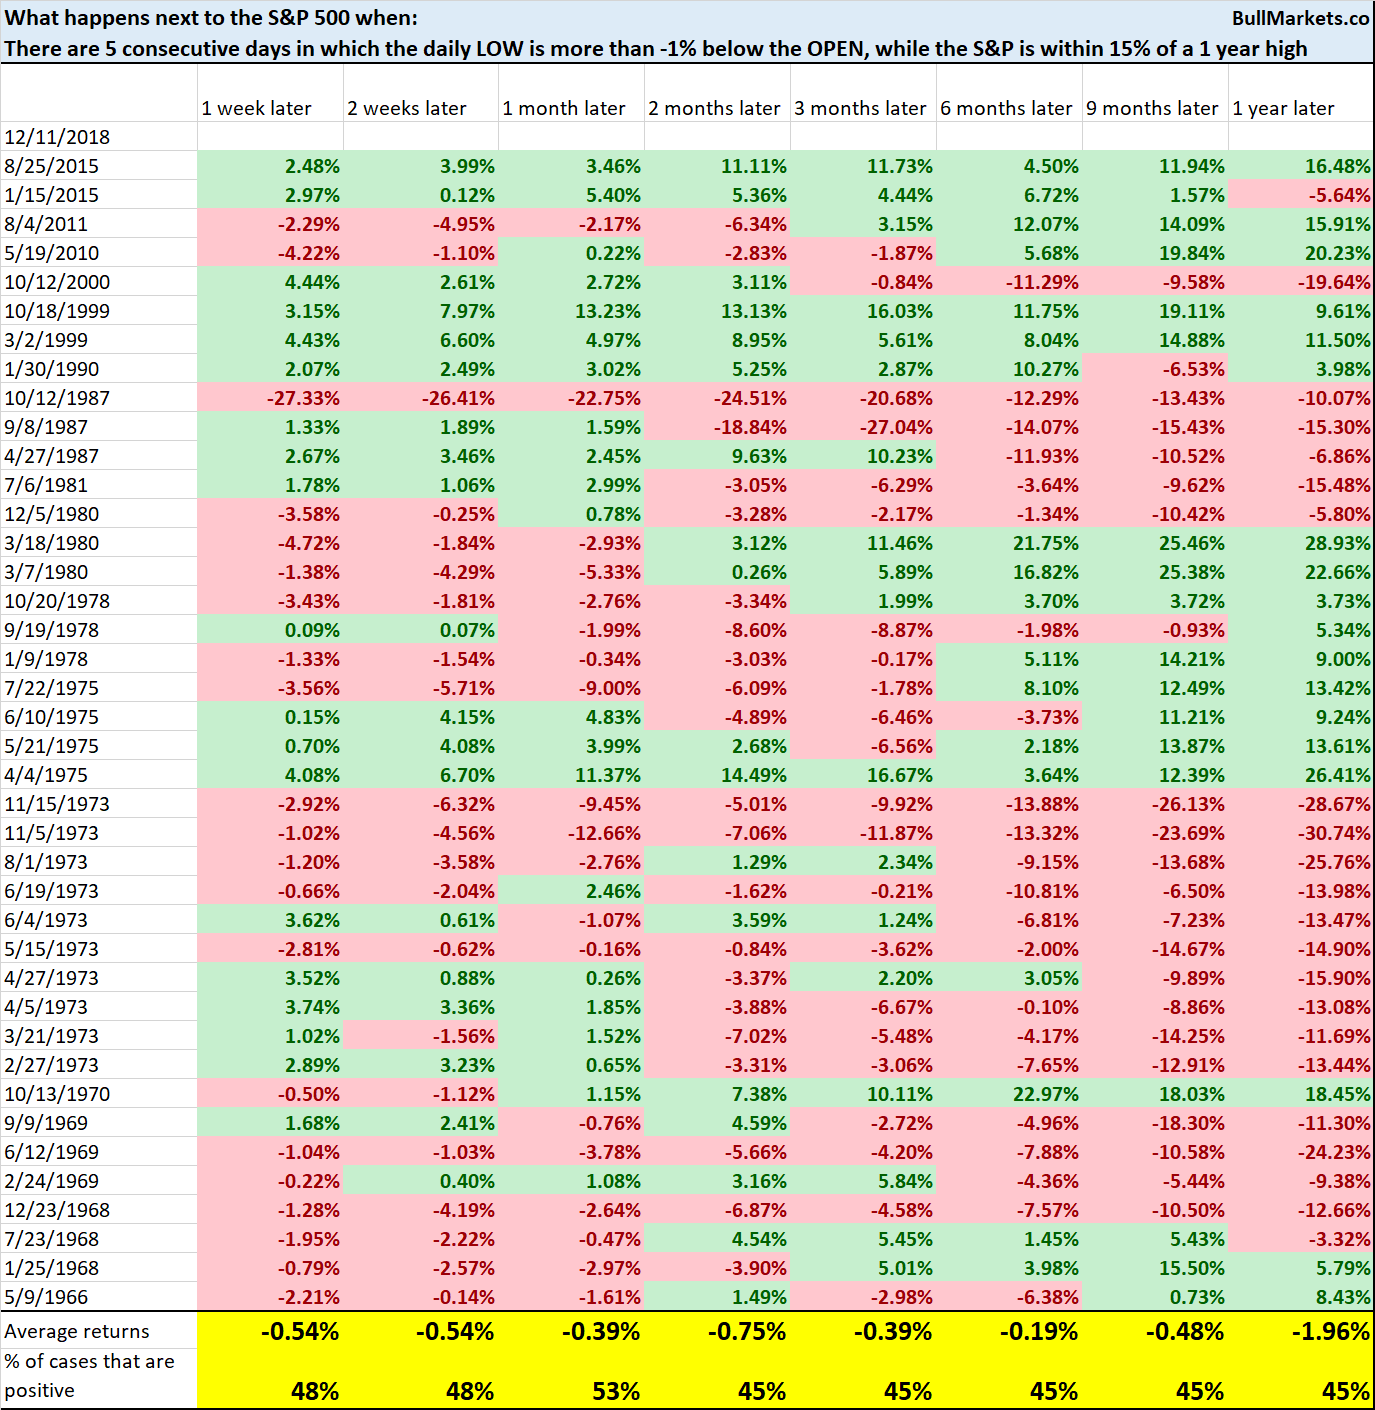
As you can see, this isn’t consistently bearish for the stock market on any time frame, although forward returns are slightly worse than random.
Volume
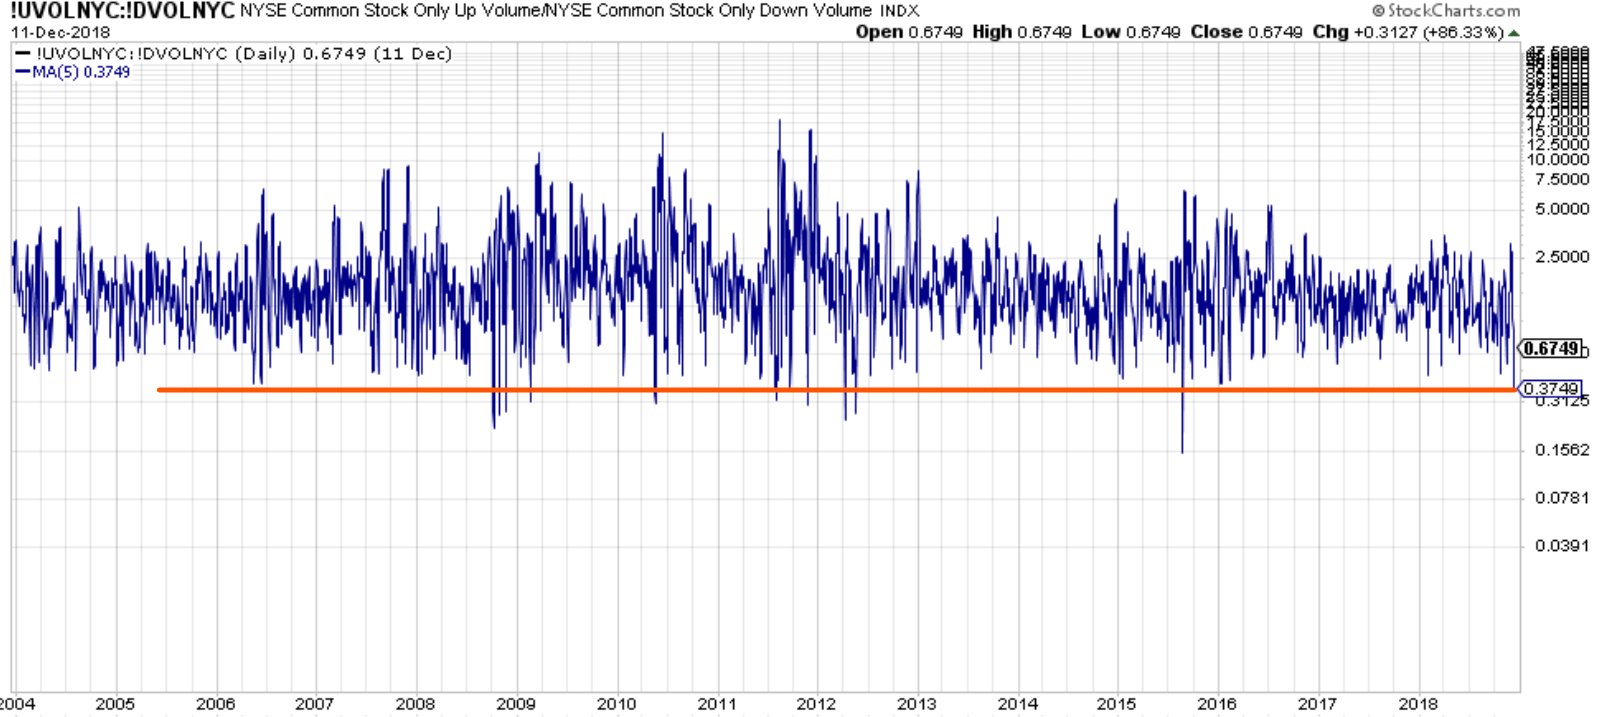
There has been a lot of downwards volume over the past week, which is normal during a selloff. However, the downwards volume has become somewhat extreme. Here’s the 5 day moving average of the NYSE Up/Down Volume Ratio.
Here’s what happens next to the S&P 500 when the 5 day moving average of the NYSE Up/Down Volume Ratio fell below 0.4
*Data from 2003 – present
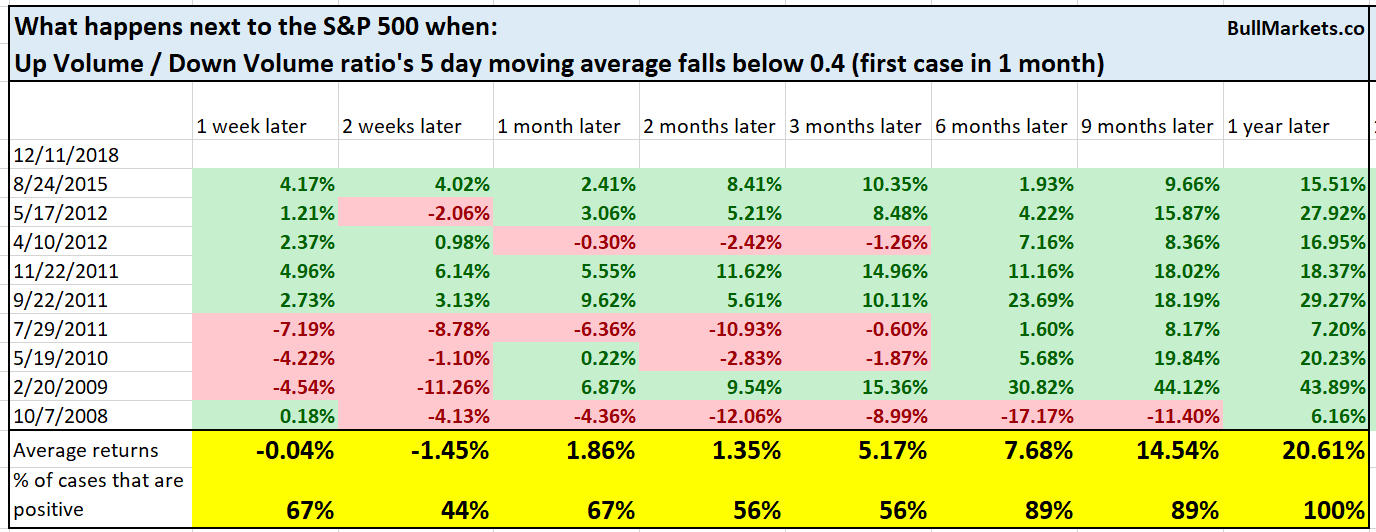
The stock market’s forward returns were bullish 6 – 12 months later.
What isn’t bearish for the stock market
Some traders that I know are looking for the % of stocks above their 200 dma to fall even more before they buy. Their logic is “the % of stocks above their 200 dma today is a lot higher than it was in February 2016”.
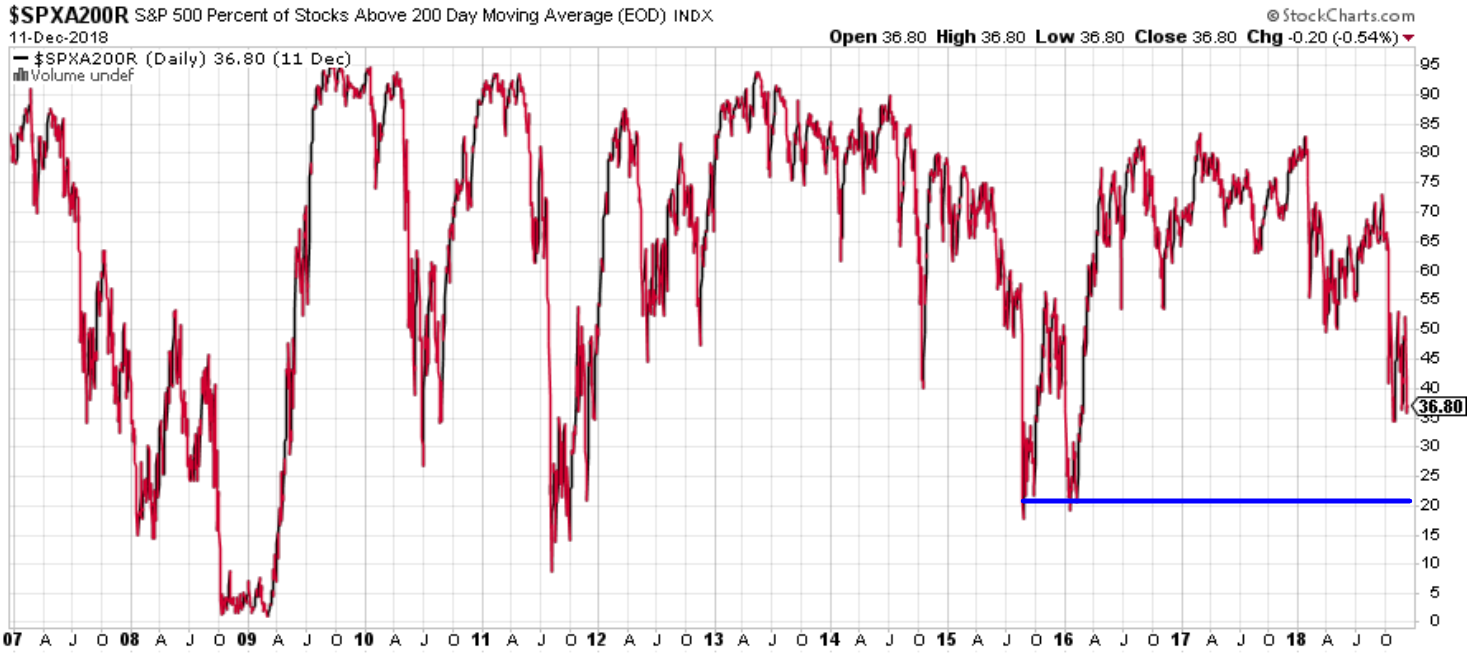
This kind of thinking makes no sense. The stock market is down -11% today, while it was down -15% in February 2016. So of course the % of stocks above their 200 dma today is higher than it was in February 2016!
Based on this kind of logic, one would only ever buy stocks if the stock market fell at least -15%.
Gold:silver ratio
The gold:silver ratio remains stubbornly high, which is why many big funds, investors, and traders are bullish on precious metals.
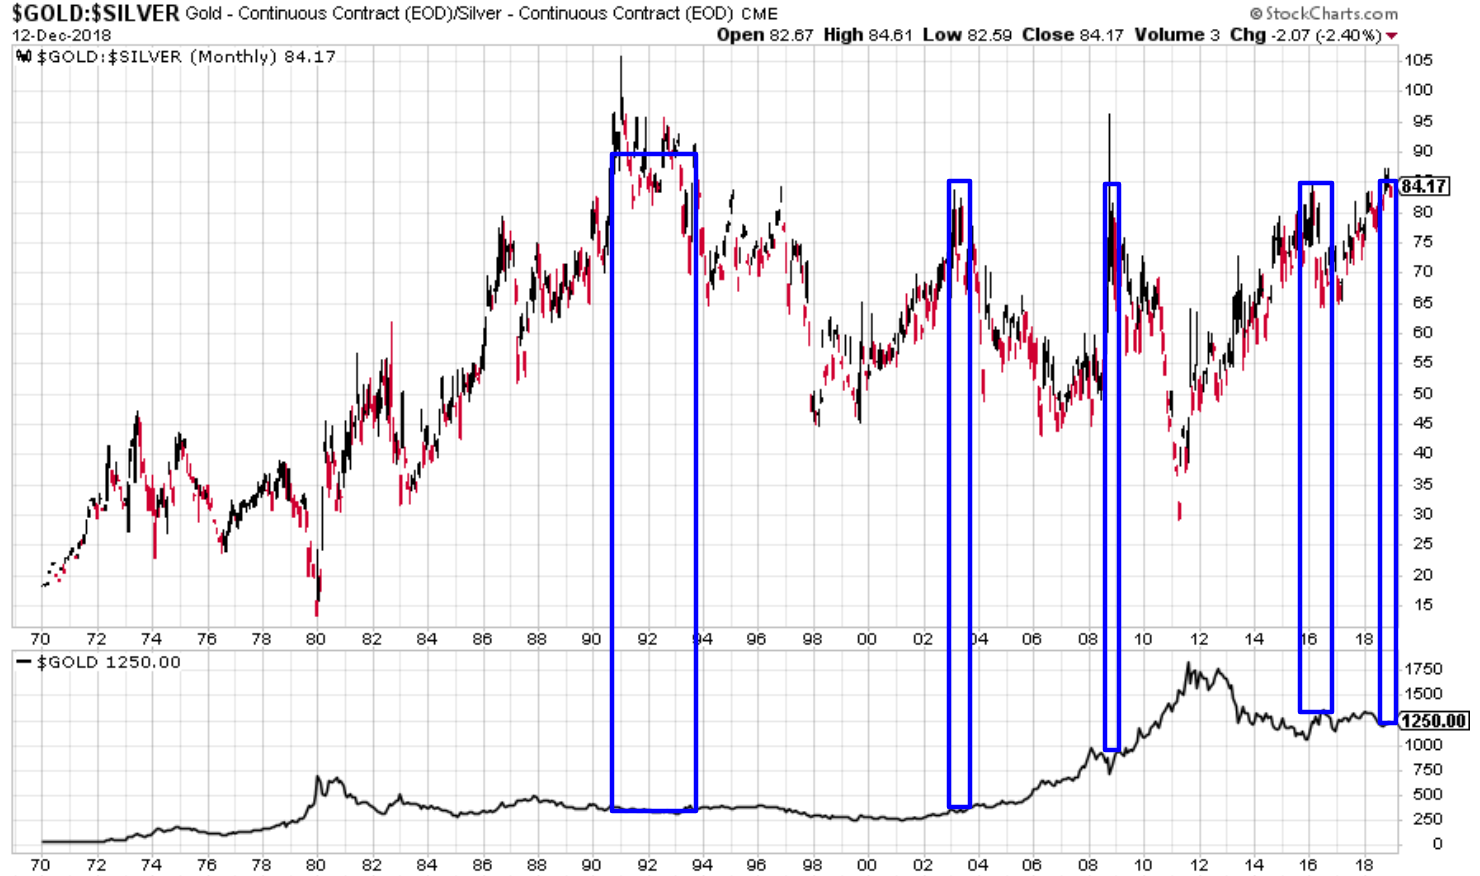
However, eyeballing a chart often results in wrong conclusions because people see what they want to see when eyeballing a chart.
Here’s what happened next to gold when the gold:silver ratio exceeded 85.
*Data from 1973 – present
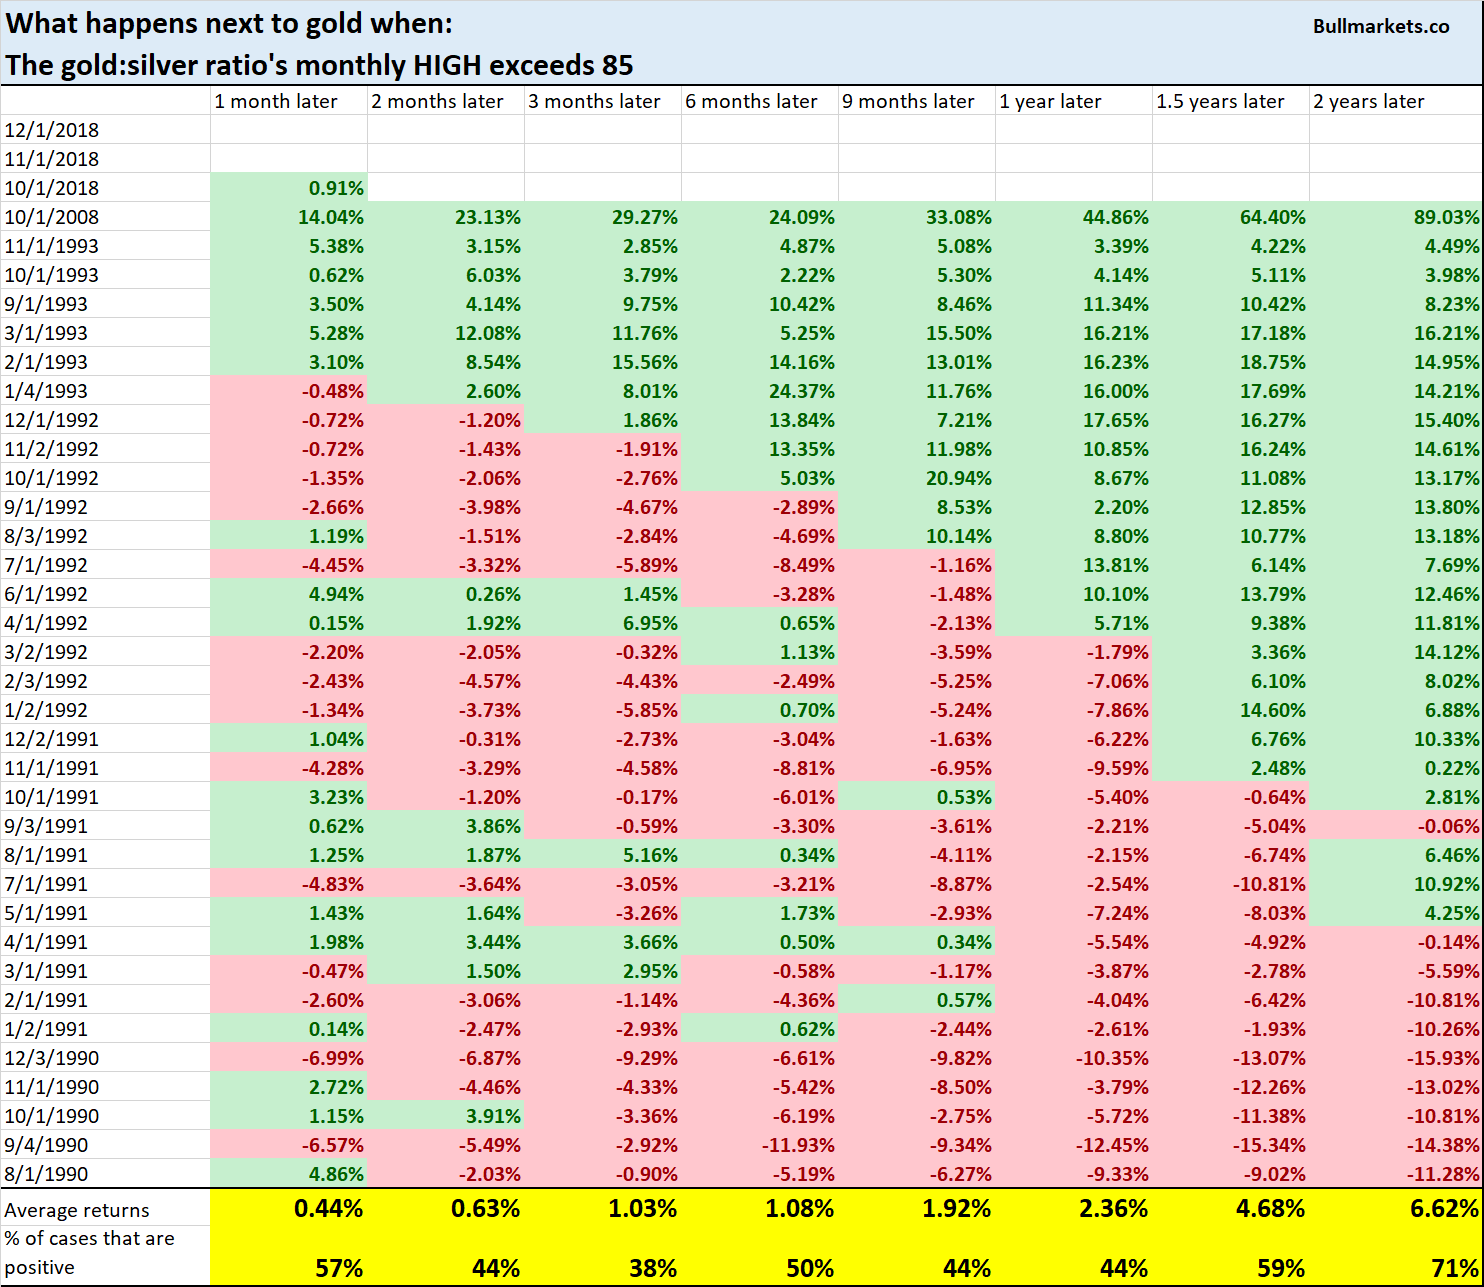
As you can see, this is neither consistently bullish nor bearish for gold, except maybe 2 years later.
Our market studies have been mixed recently, which highlights that towards the end of bull markets, fundamentals are more useful than technicals.
Click here for yesterday’s market studies
Conclusion
Here is our discretionary market outlook:
- For the first time since 2009, the U.S. stock market’s long term risk:reward is no longer bullish. This doesn’t necessarily mean that the bull market is over. We’re merely talking about long term risk:reward.
- The medium term direction is still bullish (i.e. trend for the next 6-9 months)
- The short term is a 50/50 bet
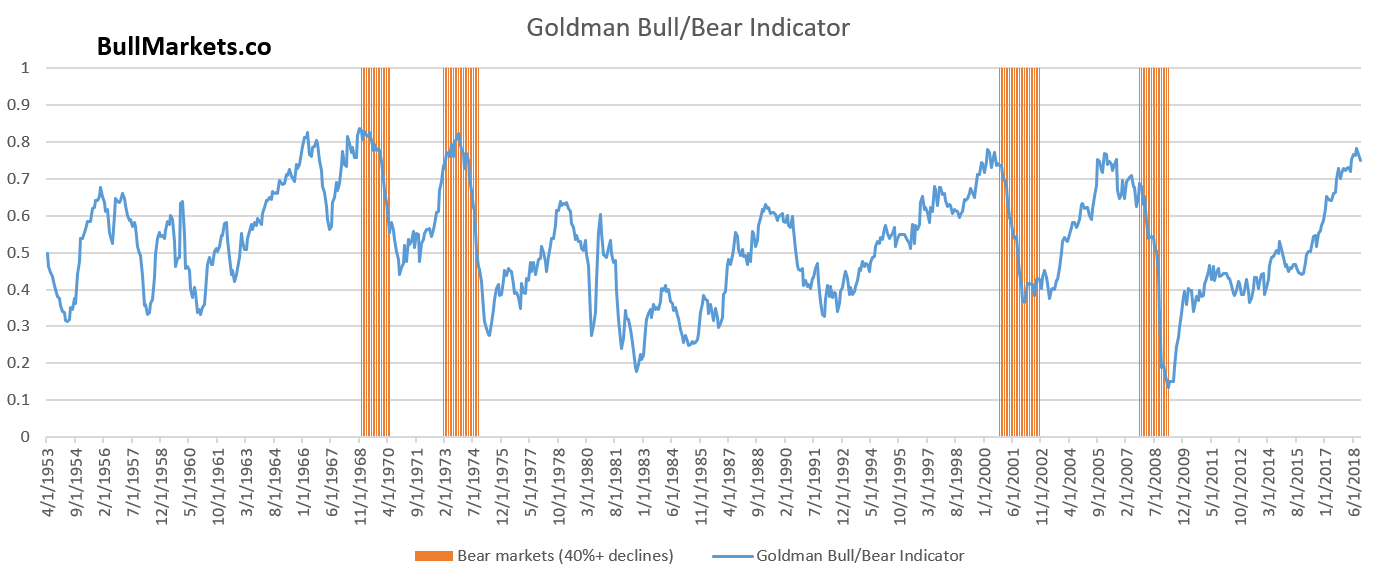
Goldman Sachs’ Bull/Bear Indicator demonstrates that while the bull market’s top isn’t necessarily in, risk:reward does favor long term bears.
Our discretionary outlook is not a reflection of how we’re trading the markets right now. We trade based on our clear, quantitative trading models, such as the Medium-Long Term Model.