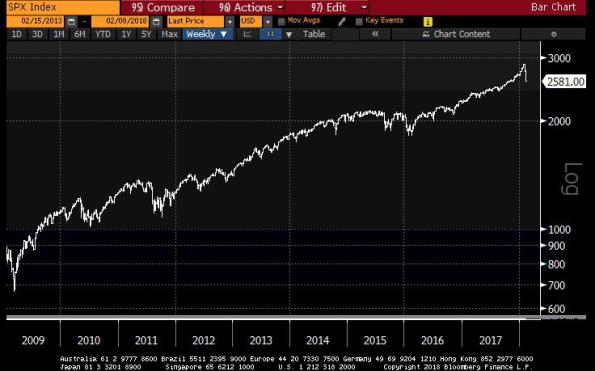
A ten percent decline in stocks is not exactly a big deal. Perhaps it feels like a big deal because 10% in one week is somewhat dramatic, but then so is +7% in one month, on top of already-richly-valued markets, in the grand scheme of things. But can we put this in perspective?

Oh dear! How awful!
I pointed out on Monday that saying “nothing has changed in the economy – it’s still strong” is useless pablum if we are entering a bear market. But it’s useful to remember that over a one-week period, literally almost nothing changes about the backdrop. We have no new information on inflation, not much new information on earnings, not much new on the interest rate cycle. Bob Shiller won a Nobel prize in part for pointing out that market volatility is very much higher than can be explained by changes in underlying fundamentals, so this shouldn’t be a surprise.
What does change when the market moves is expectations for forward returns. When prices are lower, future expected returns are higher, and vice-versa. (This is why anyone under 40 years old, for whom the lion’s share of their investing life is in front of them, should be totally cheering for a massive market rout: that would imply they have the opportunity to invest at lower prices).
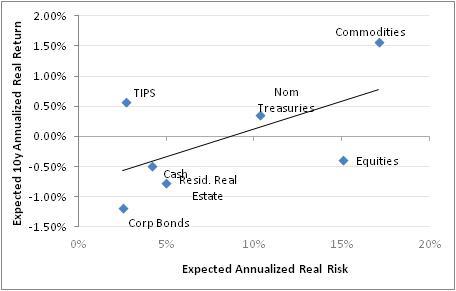
So let’s look at how those forward returns look now, and how they have changed. Of course, we look at these things every day, and every day develop a forecast of expected real returns across a number of asset classes. A subset of these is shown below, for prices as of January 26th: the day of the market high.

On January 26th, our expectations for the annualized 10-year real return for equities was -0.39%. In other words, we expected investors to underperform inflation by about 40bps per year on average over the next decade. 10-year TIPS yields were at 0.57%, and we expected commodity indices to return about 1.57% per annum. So, commodities had an advantage of about 2% per year over equities – plus some inflation-protection beta to boot. Expected commodities returns have been fairly stagnant, actually, because while the indices have rallied (implying lower future spot commodity returns) they have also gotten a push from higher interest rates and carry. (I wrote in mid-January about “Why Commodities Are a Better Bet These Days” and that’s worth reviewing.)
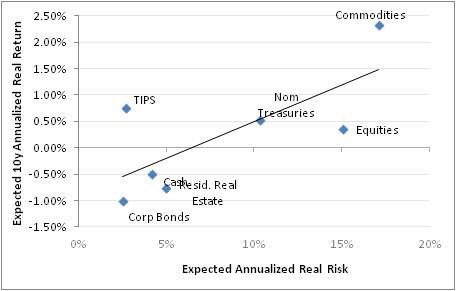
After the debacle of the last ten days or so, here is where our expected returns stand, as of the close on February 8th:

The expected total real return to equities over the next decade is now positive, if only barely. Our model has equity expected real returns at 0.35% per annum over the next decade, compared to 0.74% for TIPS (so the equity risk premium is still negative, though less so) and 2.33% for commodities (higher interest rates and lower spot prices have helped there). Again, these are entirely model-based, not discretionary. It is interesting that the premium for commodity index investing is still about 2% over stocks. Also interesting is that the slope of the risk curve is steeper: in late January, you had to accept 11% more annualized real risk to get just 1% additional real return; as of today, that slope implies 7% as risky assets have cheapened up. But as recently as 2014, that slope was 3%!
A flattening of the risk/reward curve over the last half-dozen years was no accident. I’ve written over the years about the “Portfolio Balance Channel,” which is how the Fed referred to helping the economy by taking all of the safe instruments away so that people had to buy riskier assets. The result, of course, was that riskier assets got much more expensive, as they intended. (Back in July I wrote a piece called “Will The Fed's Balance Sheet Reduction Be Bad For Stocks?” where I pointed out that unwinding QE implies that the Portfolio Balance Channel would eventually cause money to come out of equities and other asset classes to go into bonds.)
In my mind, an expected real return of 0.35% from stocks while TIPS yield more (with no risk at the horizon) is still not very attractive. I think the risk curve needs to steepen more, and we know that in the long run the expected return to equities and commodities should re-converge. Whether that’s from commodity returns coming down because commodity prices rally, or from equity returns going up because equity prices fall, I don’t know. But I would skew bets at the risky end of the curve to commodities, personally (it’s not like I haven’t said this before, however).
I started this article by pointing out how relatively insignificant the movement in the markets has been so far. I don’t mean, by pointing this out, that investors should therefore dive back in. No, in fact I think it is fairly likely that the decline has much further to go. Merely retracing 38% of the bull market – which is a minimum retracement in a normal Fibonacci sequence – would put the S&P back to 2030. This would also have the advantage from a techie’s standpoint of causing the decline to terminate in the range of the prior fourth wave…but I digress.[1]
A decline of that magnitude would also, in conjunction with rising earnings, bring the Shiller P/E back to the low-20s – still above average, but not outrageous. And it would raise the expected 10-year real return up to around 3%, which is arguably worth investing in. It would also mean that, in real terms, the S&P 500 index would have had no net price appreciation since the peak of the tech bubble – your dividends would be your whole return, and not so bad as all that, but…that’s thin gruel for 18 years of “stocks for the long run.”
[1] Although I have used some technical analysis terms recently, I’m not really a technician. However, I recognize that many traders are, and having some knowledge of technical analysis gives one some guideposts around which a tactical plan can be formulated.
