If you watch and participate in markets long enough – and no, we’re not talking about, “On a long enough timeline…” – you’ll appreciate or get bitten (as we certainly have from time to time) by the sardonic irony that often becomes exposed by a market’s cycle. Consider Mohamed El-Erian’s “New Normal” market strategy, that aimed at the start of this decade to capture the anticipated outperformance of emerging over developed markets. Bear in mind that the phrase has stuck around since then, despite the fact that it was largely a narrative for a poor investment strategy.
What happened? El-Erian and Gross were prescient in inventing the term “new normal” to describe a very slow-growing global economy with heightened risks of recession, as befell much of Europe. But they were dead wrong in predicting that emerging markets would provide outsize stock returns, and they were wildly off base in their notion that developed-market stock returns would be deeply depressed. Emerging market stocks have stumbled since 2011, and emerging market bonds have lost ground this year. Meanwhile, developed-world stock markets have soared. The fund’s use of options and other techniques to hedge against “tail risk”—which essentially means insuring against extremely bad markets—has also surely cost the fund a little in performance. – Kiplinger, November 14, 2013
Not to overly pick on El-Erian here, who is typically a very thoughtful and creative macro thinker – not to mention many of his new normal predictions did prove prescient, with the very large exception of rising inflation that would have likely driven a successful investment strategy – not just a convenient catch phrase… but, ironically, it appears his timing earlier this year of calling for an end of the new normal, as selectively revisionist as they paint it, might provide a fitting bookend to the market’s wry sense of humor.
Eight years later – and instead of just getting slow growth right in a developed economy like the US, as he initially suggested in May 2009, his other two major tenets of rising inflation and rising unemployment might eventually be realized domestically in the economy’s next chapter. In fact, from our perspective it seems more likely than not.
In theory, markets should be easier to game. They’re expressed in broad sweeping moves with pronounced peaks and valleys that on paper – and in hindsight, present clear transitional signals. Buy here, sell there – what’s the big deal? The problem, however, is that timing the transitions, which are driven by inherent human behaviors, prove exceptionally challenging, especially over the short to intermediate-term and when the largest central banks are intervening in the markets on a massive global scale.
For as long as markets have functioned broadly, participants have attempted to place a quantitative framework around and over them to better understand, describe and hopefully exploit their machinations. And while it does provide some context, ultimately, they’re still driven by behavioral incentive that might best be described as non-linear and reflexive across shorter timeframes that more or less eventually conform with general equilibrium theory. The paradox is holding both the quantitative and qualitative schools of reason in mind and existing in a space seemingly governed by both free will and determinism. That said, if we weren’t wired this way, capitalism wouldn’t function as a one-way street for long (e.g. see communism). Icarus eventually flies too close to the sun, and in this alternate parable, Godot – i.e. inflation – surprises everyone and shows up.
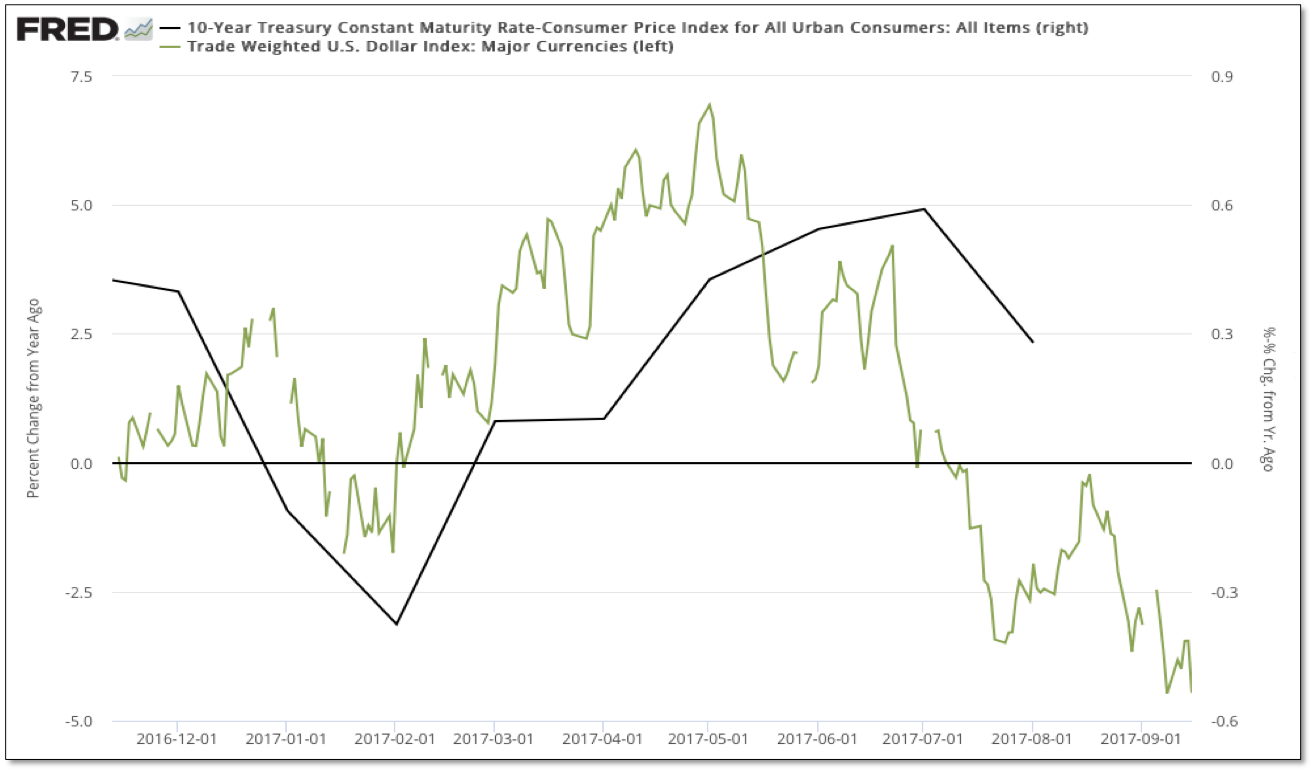
As we alluded to in our note last month (see here), it was a good bet that the inflation data was due to turn up again, as US dollar strength (on a year-over-year performance basis) had run its course in May. We’ve pointed out over the years that the YOY performance of the dollar has led the inflation data and we’ve closely followed the rollover in real yields (here the 10-year less CPI) since 2015, as it has positively correlated with the YOY performance of the dollar. Last week’s CPI data confirmed the expected turn, with headline CPI coming in at 1.9 percent YOY, modestly higher than the median forecast of 1.8 percent YOY for August.
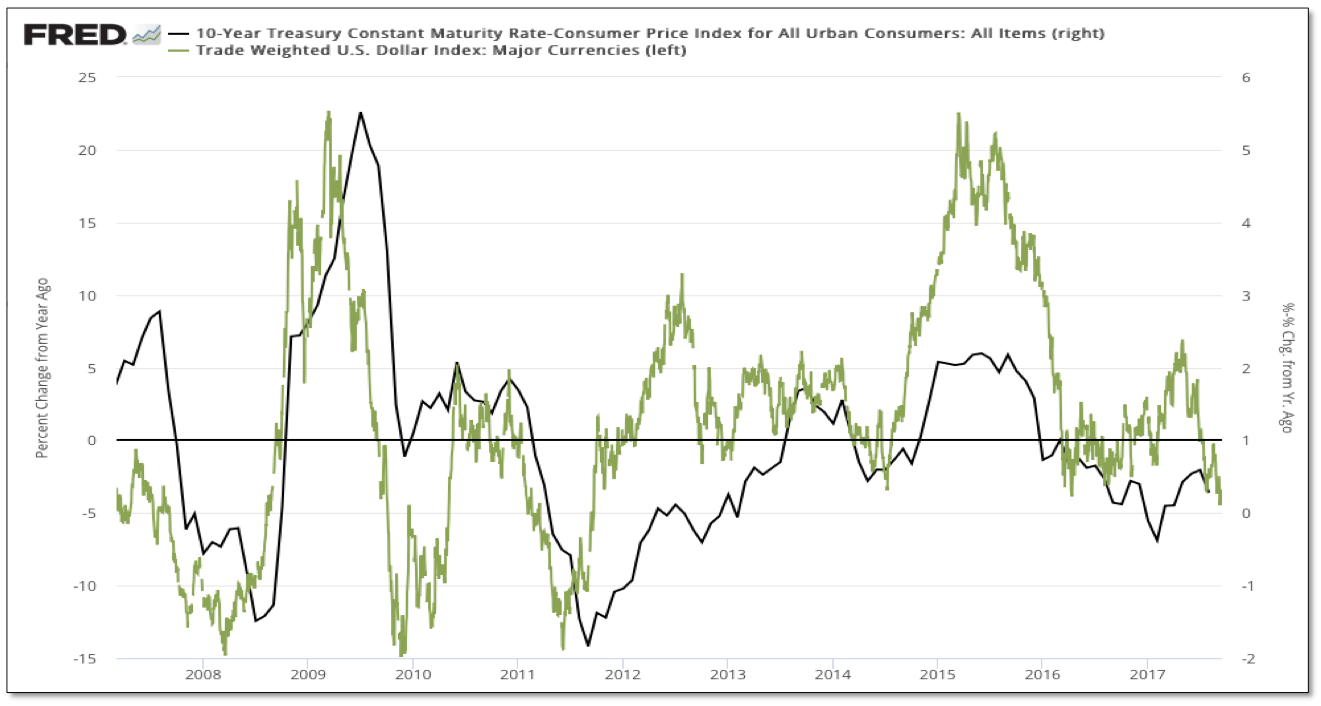
So where does that leaves us going forward? Extrapolating the downtrend and YOY performance in the dollar this year, the inflation data should continue to firm in September. Moreover, the very broad 3-year top in the US dollar index has recently broken down below long-term support, which we’ve approached as a major fulcrum for the next legs in inflation (we believe higher) and real yields (lower).
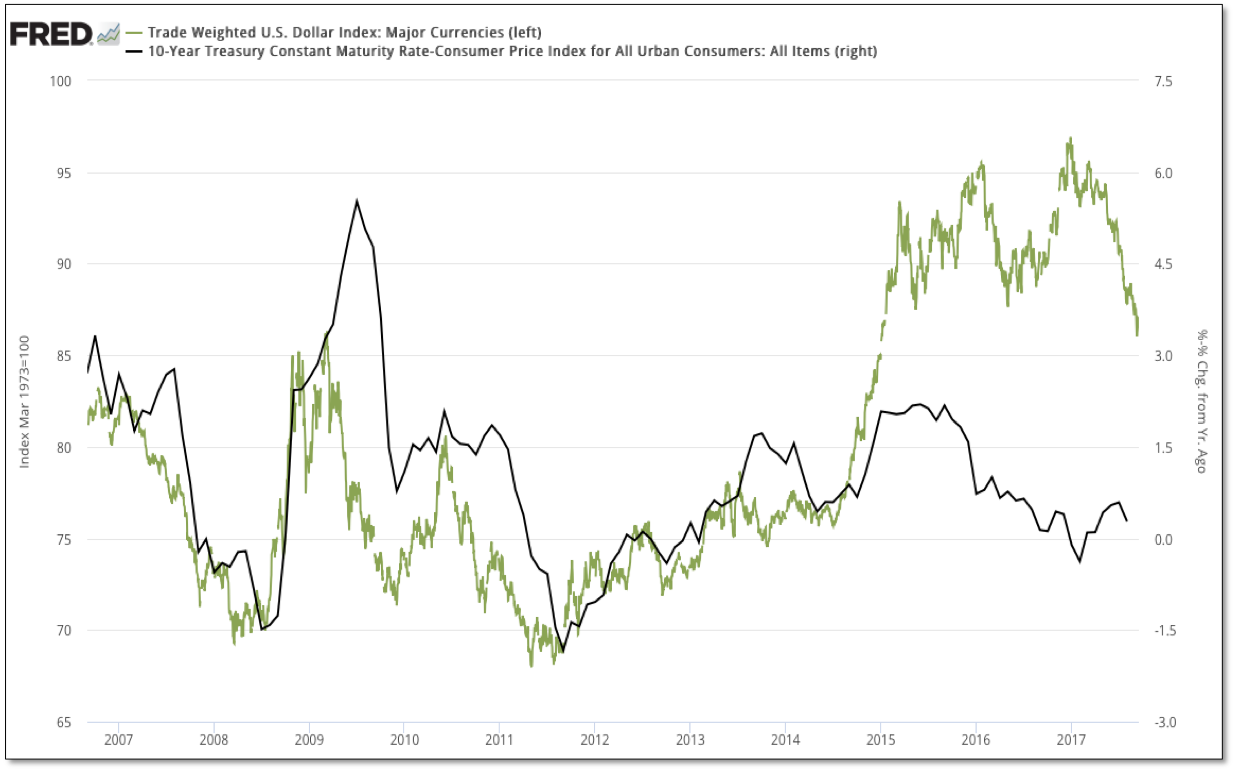
Looking back at history and distilling the last time real yields had rolled over within a negative band (mid 1970’s and mid 1940’s), a pulse of inflation eventually outstrips growth, leading to a sharp spike lower in real yields. From our perspective, it is the dollar’s relative historic extreme today and the Fed’s relative constraint with raising rates that presents the largest catalyst for a continued decline in real yields. While there are some similarities with the 1970’s through the prism of real yields, there’s still greater overlap – in our opinion, with the 1940’s when the Fed and Treasury were last involved in a large-scale asset purchase program and yields were troughing within the secular long-term cycle.
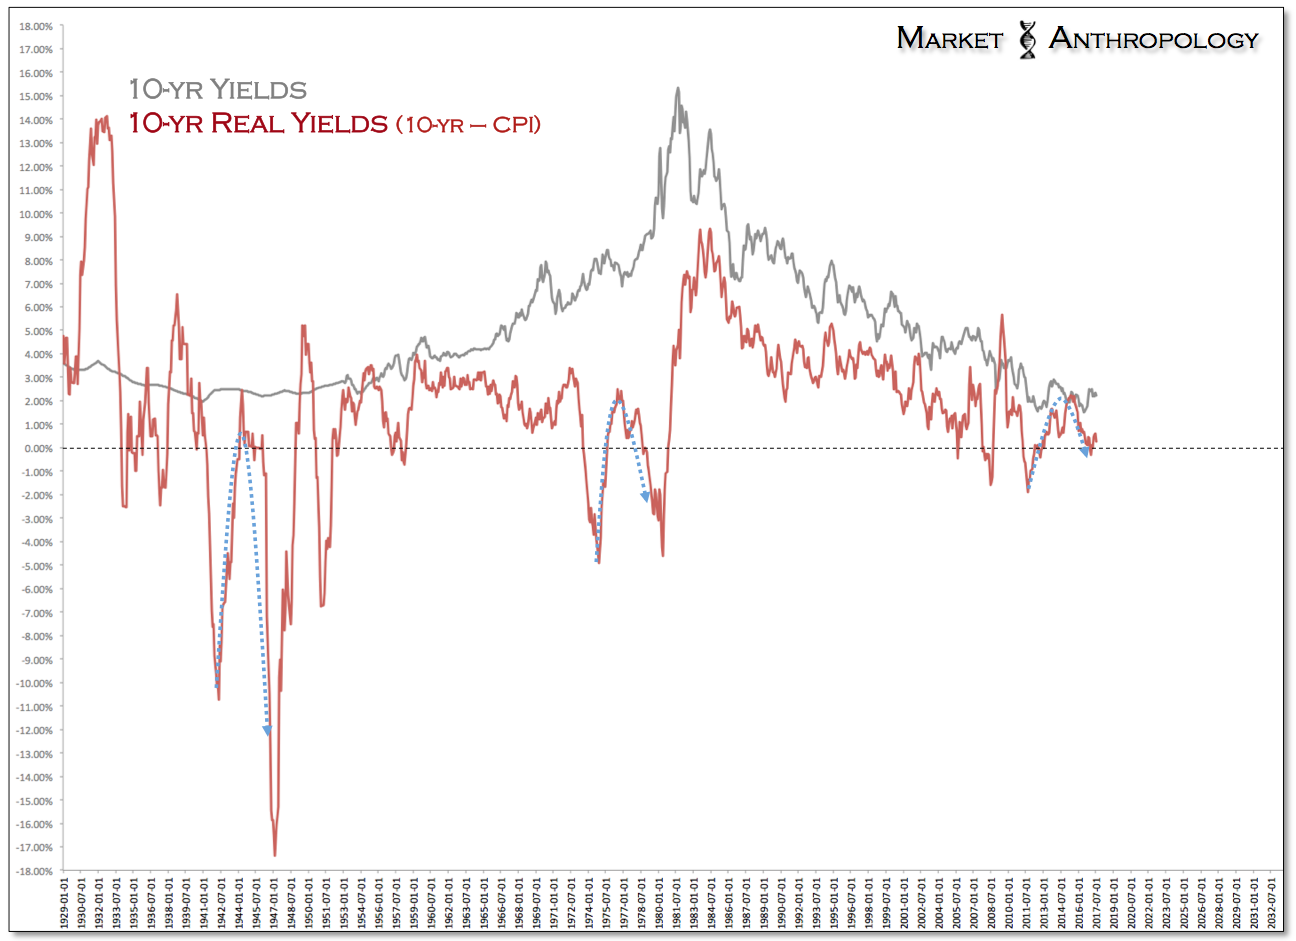
Although the equity markets here in the US have continued to defy gravity, we suspect similar to the completion of the cyclical bull market of the mid 1940’s, their fate will be sealed when realized inflation surprises to the upside and greater uncertainty prevails with future Fed policy. Considering the recent breakdown in the dollar, Godot could show up this fall. That said, we believe the mid-to-late 1940’s still offer some behavioral perspective with the markets today, as investors – despite quickly shunning equities, did not broadly sell Treasuries in fear of inflation.
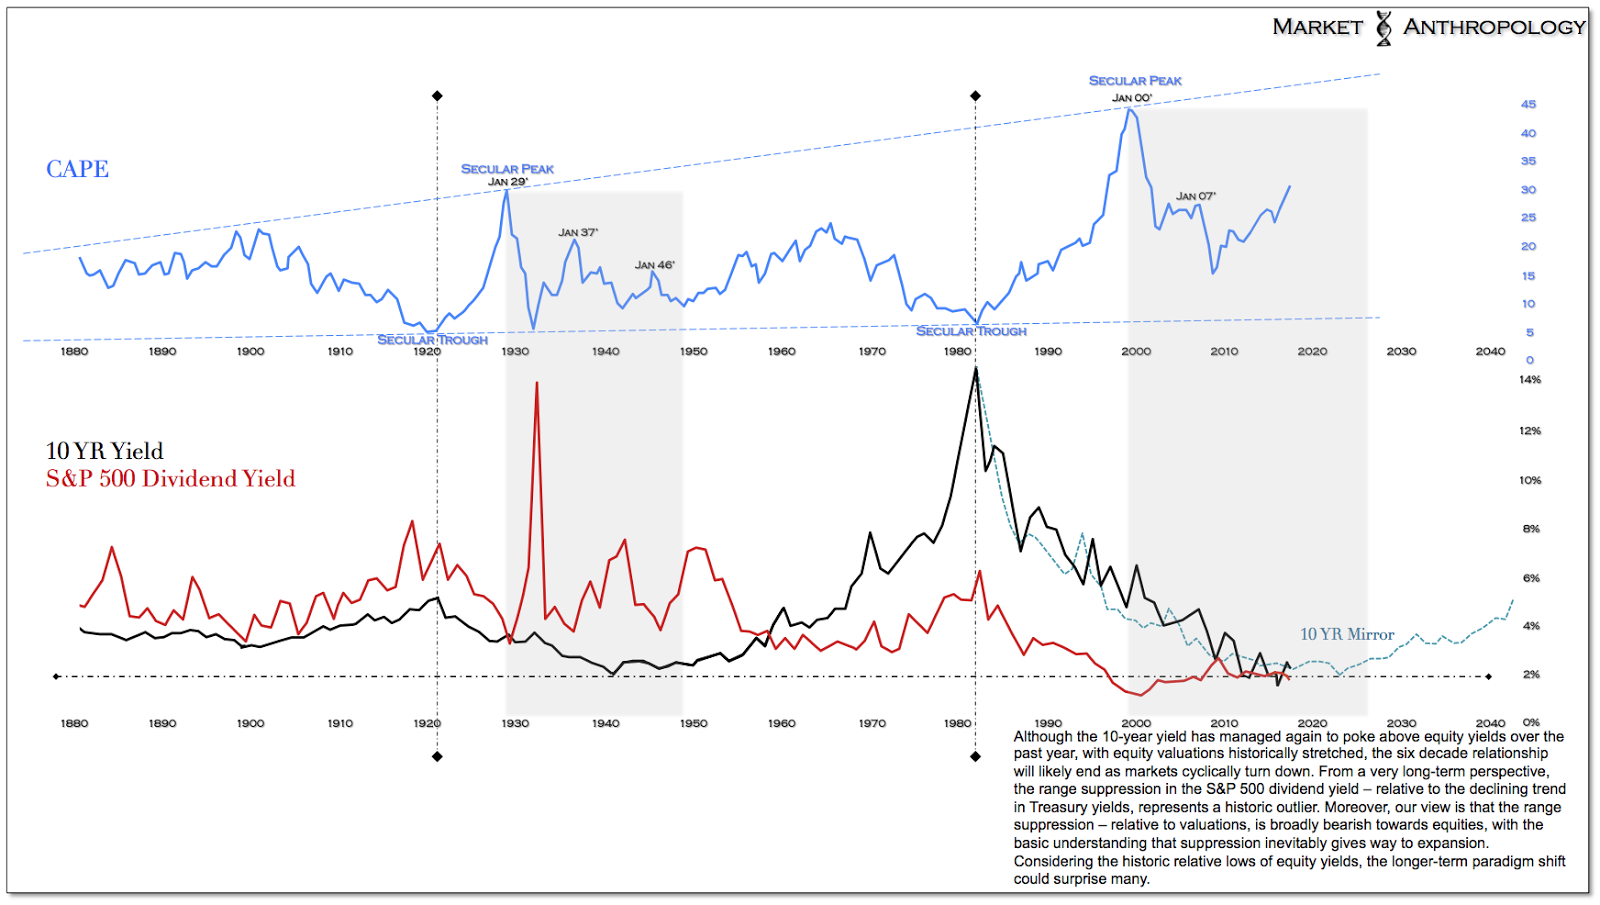
As mentioned in previous notes, in Milton Friedman and Anna Schwartz's A Monetary History of the United States, the market climate in the 1940's was described as being so suspect of the Fed and Treasury's visible hand, even after a 150 percent rally in the equity markets that began in 1942, the country went through a recession in 1945 and exhausted around Memorial Day in 1946, participants by and large didn't trust the market or expect inflation to rise as precipitously as it did from the trough going into 1947 and 1948.
"Despite the extent to which the public and government officials were exercised about inflation, the public acted from 1946 to 1948 as if it expected deflation."
"… An important piece of evidence in support of this view is the harbinger of yields on common stocks by comparison with bond yields. A shift in widely-held expectations toward a belief that prices are destined to rise more rapidly will tend to produce a jail in stock yields relative to bond yields because of the hedge which stocks provide against inflation. That was precisely what happened from 1950 to 1951 and again from 1955 to 1957. A shift in widely-held expectations toward a belief that prices are destined to fall instead of rise or to fall more sharply will tend to have the opposite effect - which is precisely what happened from 1946 to 1948." - Milton Friedman and Anna Schwartz, A Monetary History of the United States, 1963
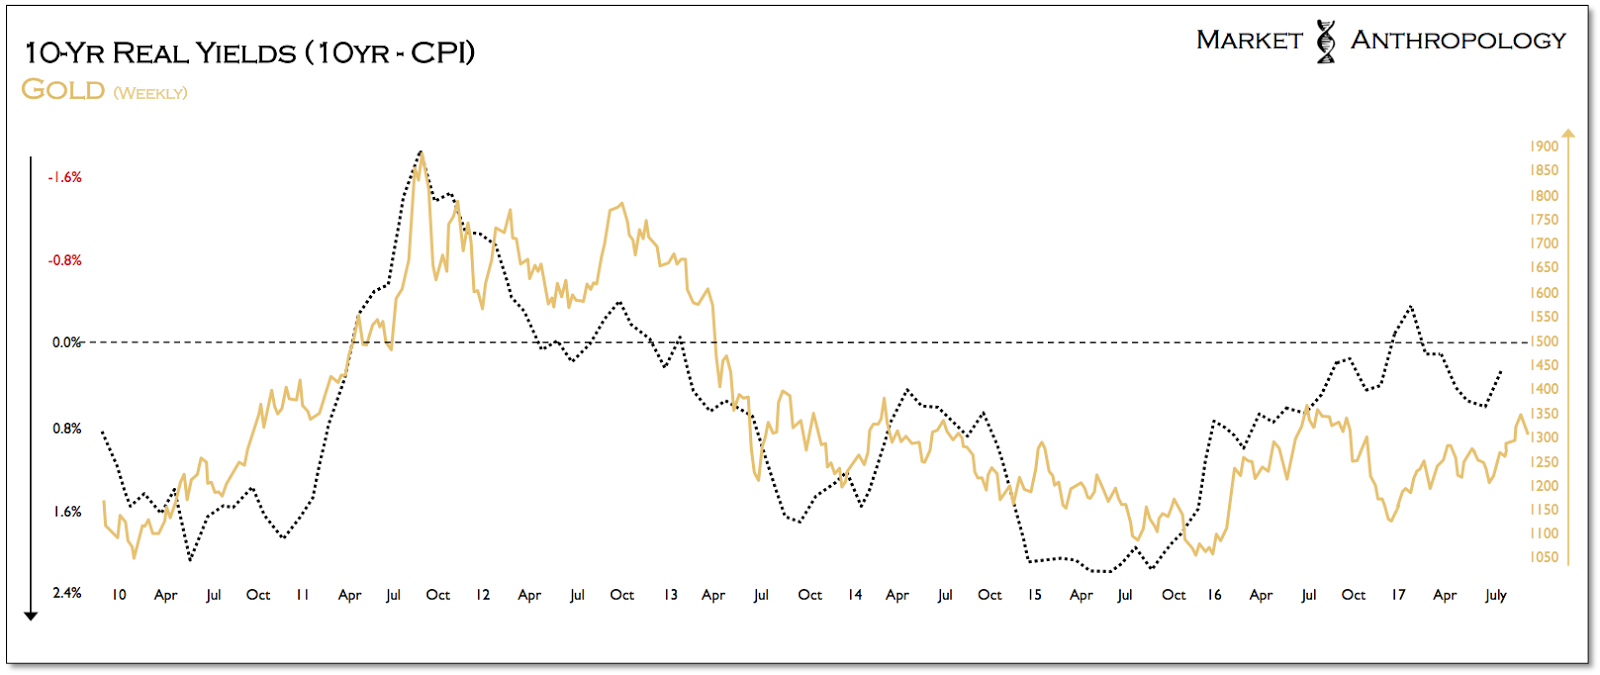
Consequently, we continue to like the long-term prospects for gold, as it has displayed a strong inverse correlation with real yields and should also benefit from the prospective safe-haven demand generated by the eventual cyclical decline in equities. All things considered, when Godot walks in – you best be wearing some.
