
In two days, corn prices dropped 85 cents, or 11.6% of its value. Is that drop the end of the end, the beginning of the end or the middle of the end?
I have traded corn since 1975 -- initially at the Chicago Board of Trade for a division of Continental Grain Company and then as a private speculator. I trade markets primarily based on classical chart patterns, volume and open interest, plus an appraisal of the market's conventional wisdom.
Mid Correction
Based on my experience trading corn, I believe the huge price decline of the past two days represents the middle of a major correction in corn prices -- that this decline should bring prices to $5.10 per bushel (nearby contract) from Monday’s close of $6.43.
Of course, farmers reading this post will object to my prediction and claim that such a price decline is against the laws of nature and common sense. Yet ever since I started trading corn I have observed that farmers represent a population group that gets very rich from land prices, while continually complaining about crop prices.
Part Of A Larger Move
A massive price thrust, such as we experienced on March 30 and April 1, almost always occurs at the beginning, middle or end of a much larger move. Of course, farmers will claim that this price decline is the end of a larger price decline from the August 10, 2012 high. I believe that the thrust will end up being the middle point of a price decline from last Fall.
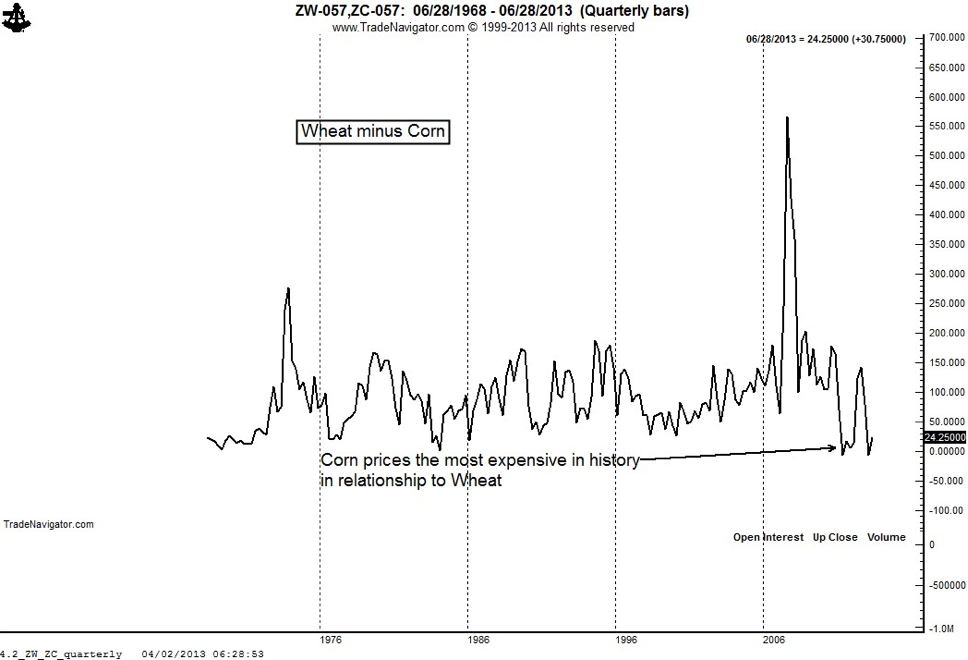
The quarterly chart shows that Corn is still historically expensive. Remember, the free market is not obliged to provide farmers with a perpetual bull market. A likely stopping point for this decline would be $5.10, the 1996 high and the 2012 low.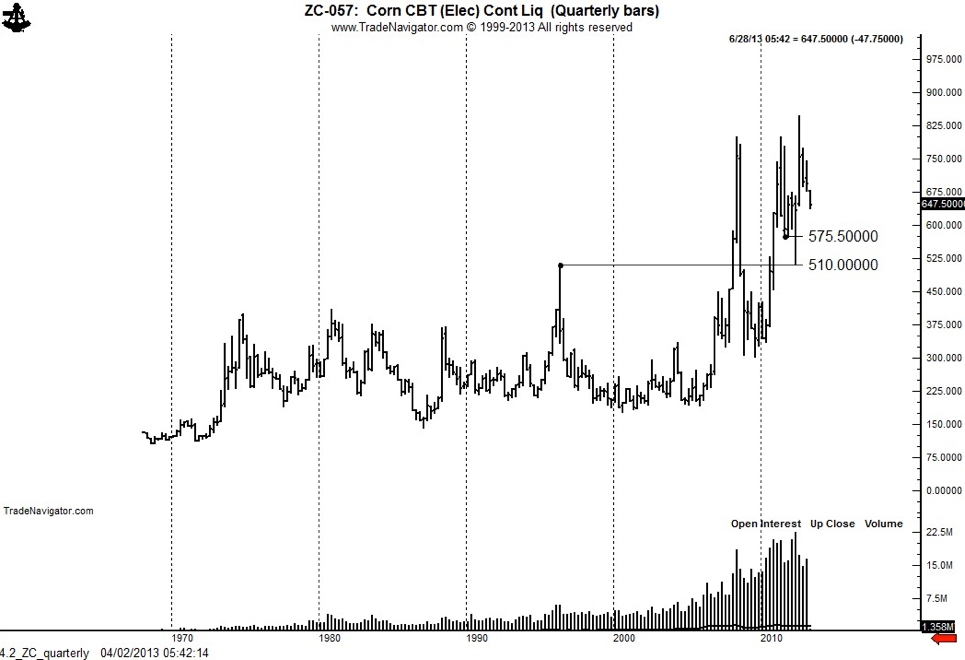
Support-Line Gap In Price
The daily chart is the one I find most interesting as a chart trader. Note that the price thrust of the past two days gapped through an important support line at $6.70. There is no question but that the April 1 gap has significance. The question is whether it is an area gap, an exhaustion gap, a measuring gap or a breakaway gap. These are the four different types of gaps that can occur on a price chart.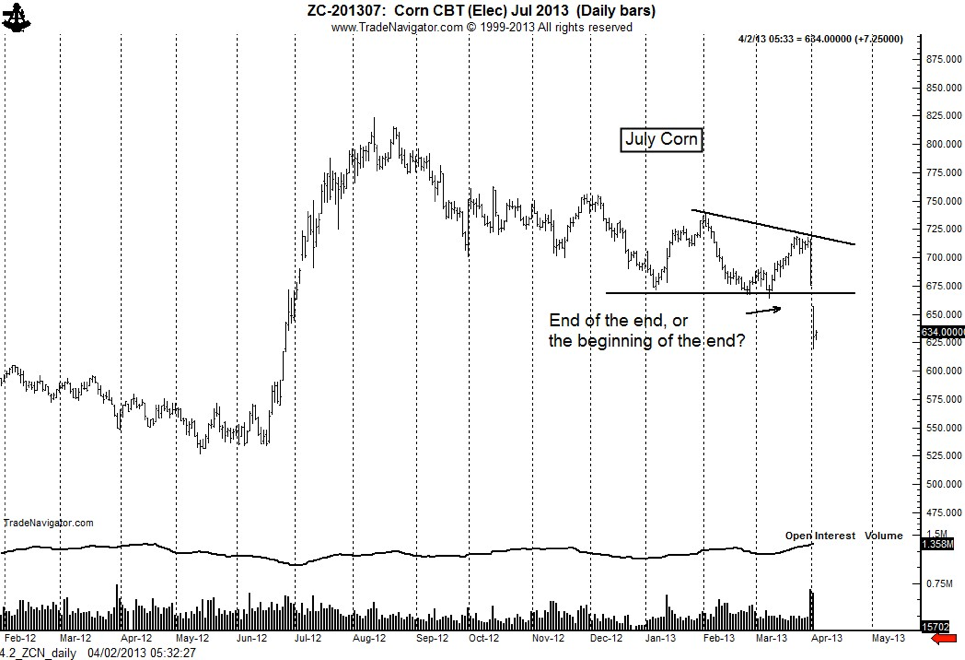
I do not consider the April 1 gap to be an area gap, because the price gap was clearly outside of the most recent congestion zone. Area gaps occur within a broader price consolidation. I also do not consider the April 1 gap to be a breakaway gap because seven months of price decline preceded it. This leaves us with the options of a measuring or exhaustion gap.
Bear Trend
I vote for the measuring gap. An exhaustion gap most often occurs at the end of an existing run-away trend. Corn prices have drifted sideways for the last three months. A measuring gap, in contrast, often occurs at precisely this stage of a bear trend.
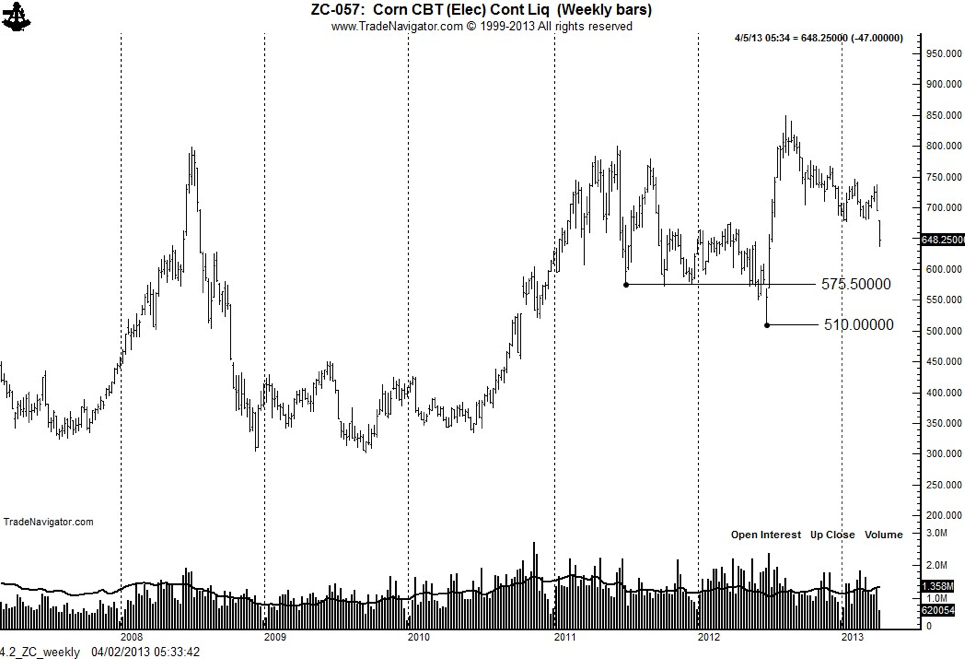
Measuring gaps most often mark the “half-way” point of a bear trend. If the April 1 gap is of the measuring variety, the “measured” target is $5.10, incidentally a point of importance on the weekly and quarterly graphs.
Relative To Soybean And Wheat
There is one other factor that would support the hypothesis of the measuring gap -- and that is the price relationship of corn to soybeans and wheat. The ratio of Corn prices to the prices of Soybeans and Wheat dictate the planting decisions of farmers and the consumption decisions of users (livestock feeders). As the charts below show, corn is coming off a period of extreme over evaluation in relationship to wheat and soybeans. It is difficult for me to believe that this extreme over evaluation is ending with an exhuastion gap in the price of corn. In fact, the ratio charts would bettter argue for the April 1 gap to be a breakaway gap.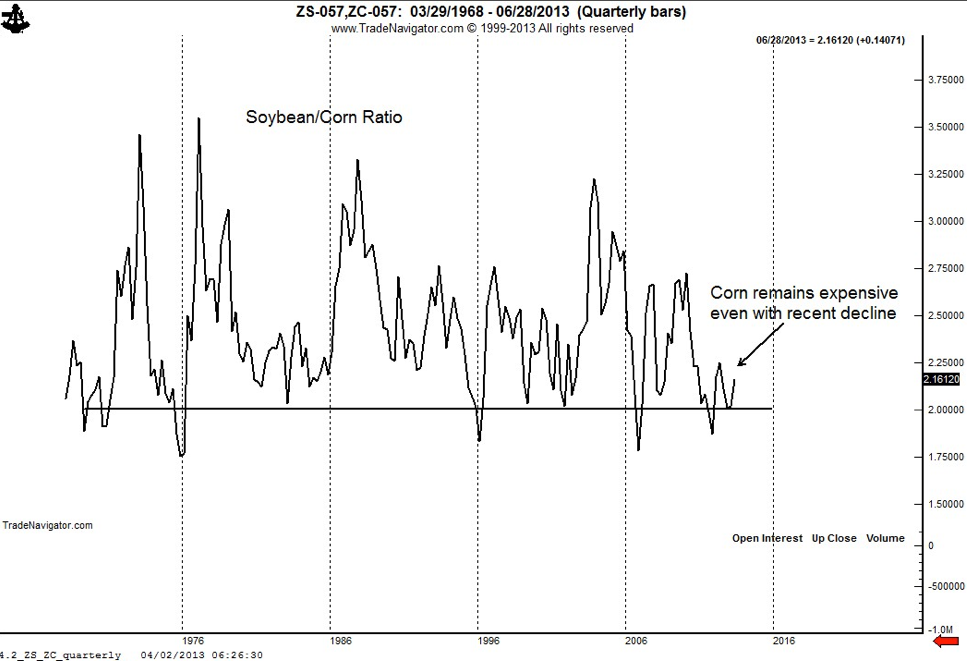
The Play
From a trading standpoint, I am short corn and want to add to the position. However, Corn prices have dropped too far too fast, and a sharp correction could (but does not have to) occur at any time. July corn could rally to $6.60 to $6.70. Especially if such a rally develops this week, increased short position exposure would be my call.
- English (UK)
- English (India)
- English (Canada)
- English (Australia)
- English (South Africa)
- English (Philippines)
- English (Nigeria)
- Deutsch
- Español (España)
- Español (México)
- Français
- Italiano
- Nederlands
- Português (Portugal)
- Polski
- Português (Brasil)
- Русский
- Türkçe
- العربية
- Ελληνικά
- Svenska
- Suomi
- עברית
- 日本語
- 한국어
- 简体中文
- 繁體中文
- Bahasa Indonesia
- Bahasa Melayu
- ไทย
- Tiếng Việt
- हिंदी
What's With The Price Of Corn?
Published 04/02/2013, 12:35 PM
Updated 07/09/2023, 06:31 AM
What's With The Price Of Corn?
3rd party Ad. Not an offer or recommendation by Investing.com. See disclosure here or
remove ads
.
Latest comments
Install Our App
Risk Disclosure: Trading in financial instruments and/or cryptocurrencies involves high risks including the risk of losing some, or all, of your investment amount, and may not be suitable for all investors. Prices of cryptocurrencies are extremely volatile and may be affected by external factors such as financial, regulatory or political events. Trading on margin increases the financial risks.
Before deciding to trade in financial instrument or cryptocurrencies you should be fully informed of the risks and costs associated with trading the financial markets, carefully consider your investment objectives, level of experience, and risk appetite, and seek professional advice where needed.
Fusion Media would like to remind you that the data contained in this website is not necessarily real-time nor accurate. The data and prices on the website are not necessarily provided by any market or exchange, but may be provided by market makers, and so prices may not be accurate and may differ from the actual price at any given market, meaning prices are indicative and not appropriate for trading purposes. Fusion Media and any provider of the data contained in this website will not accept liability for any loss or damage as a result of your trading, or your reliance on the information contained within this website.
It is prohibited to use, store, reproduce, display, modify, transmit or distribute the data contained in this website without the explicit prior written permission of Fusion Media and/or the data provider. All intellectual property rights are reserved by the providers and/or the exchange providing the data contained in this website.
Fusion Media may be compensated by the advertisers that appear on the website, based on your interaction with the advertisements or advertisers.
© 2007-2024 - Fusion Media Limited. All Rights Reserved.