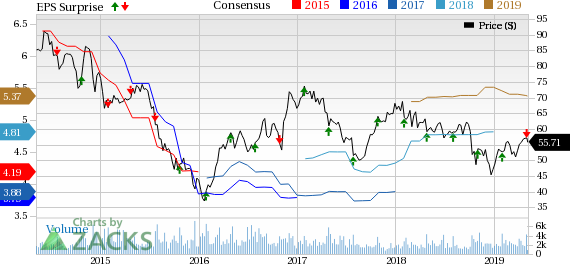
WESCO International, Inc. (NYSE:WCC) reported first-quarter 2019 earnings of 93 cents per share, missing the Zacks Consensus Estimate by 2 cents. The figure was in line with the year-ago quarter’s figure.
Net sales of $1.96 billion lagged the Zacks Consensus Estimate of $1.99 billion. Further, the figure decreased 1.6% on a year-over-year basis.
This can primarily be attributed to shipment slowdown in January and February on account of seasonal events. Further, several branch closure, workday impact and currency headwinds continued to weigh on the stock throughout the quarter.
Notably, organic sales in the reported quarter grew 1% from the prior-year quarter. Favorable pricing and robust growth in Canada and other international markets drove year-over-year sales growth.
Following the lower-than-expected first-quarter results, shares of the company have plunged 2.4%. Additionally, shares of WESCO have lost 6.8% over a year against the industry’s growth of 6.7%.
Nevertheless, the company’s sales gained momentum in March and the trend sustained in April as well. Further, WESCO remains confident on its acquisition strength. During the reported quarter, it completed the buyout of OSRAM’s Sylvania Lighting Solutions which is likely to drive sales in the lighting market in the near term.

Top Line in Detail
WESCO operates in four organized end markets, namely Industrial, Construction, Utility and CIG.
Industrial Market: Organic sales in this market were down 0.3% from the year-ago quarter, reflecting flat sales in the United States and Canada in local currency. Sales from this market accounted for 36% of total sales. WESCO noted that growth in verticals like food processing, petrochemical and metals and mining was offset by contraction in OEM customer base.
Nevertheless, strengthening industry supply opportunities and bidding activity levels acted as tailwinds for WESCO during the first quarter. Moreover, rising capital spending by customers along with increasing production and capacity utilization continued to act as catalysts.
Construction Market: Organic sales increased 2.4% year over year, with 8% growth in Canada in local currency. However, U.S. sales were down 1% year over year in the first quarter. Sales from this market accounted for 33% of total sales. The company’s growing momentum across construction contractors and customers drove the top line in this market. Additionally, strong backlog remained positive for the company.
Utility Market: Sales from this market contributed 16% to WESCO sales. The company experienced year-over-year sales decline of 0.4% in this market. This was owing to 38% decline in Canada sales which offset 3% rise in U.S. sales in local currency during the reported quarter. Canada decline can be attributed to non-renewal of a contract.
Nevertheless, continued traction among investor owned utility, public power and generation customers remained positive throughout the quarter. Further, growing construction market and rising demand for renewable energy continued to be tailwinds.
CIG Market: The company recorded year-over-year improvement of 2.2% in organic sales in this market, driven by strong performance in Canada (22% growth in local currency). However, sales were down 5% in the United States due to decreasing number of end-user technology customers.
The upside in CIG sales was driven by growing adoption of supply chain solutions in cloud, data centre and broadband projects. Further, strong growth in LED lighting solutions, fiber-to-the-X deployments and broadband build-outs drove sales.
Operating Details
Gross margin was up 19.5% in the reported quarter, expanding 40 bps from the year-ago quarter.
Selling, general and administrative expenses (SG&A), as a percentage of revenues, were 15.1%, expanding 50 bps on a year-over-year basis.
Consequently, WESCO’s operating margin came in at 3.6%, contracting 10 bps from the prior-year quarter.
Balance Sheet & Cash Flow
As of Mar 31, 2019, cash & cash equivalents were $106.1 million, up from $96.3 million as of Dec 31, 2018. Long-term debt in the first-quarter 2019 was $1.21 billion compared with $1.17 billion at the end of fourth-quarter 2018.
Additionally, WESCO generated $28.9 million in cash from operations in the reported quarter, down from $122.2 million at the end of the fourth quarter.
Free cash flow in the quarter was $18.1 million, up from $109.7 million in previous quarter.
Guidance
For second-quarter 2019, WESCO expects sales growth in the range of 3% to 6%. The Zacks Consensus Estimate is pegged at $2.17 billion
Operating margin is expected to be in the range of 4.5-4.8%. Effective tax rate is projected at 23% for the second quarter.
For 2019, WESCO expects sales growth in the range of 3-6%. The Zacks Consensus Estimate for 2019 sales is pegged at $8.52 billion. Currency headwinds are expected to offset benefits from SLS buyout.
Earnings are anticipated to be in the range of $5.10-$5.70 per share. The Zacks Consensus Estimate is pegged at $5.37.
Operating margin is expected between 4.3-4.7% for 2019.
Zacks Rank and Stocks to Consider
Currently, WESCO carries a Zacks Rank #3 (Hold).
Some better-ranked stocks in the broader technology sector are ACI Worldwide, Inc. (NASDAQ:ACIW) , Avid Technology, Inc. (NASDAQ:AVID) and Agilent Technologies, Inc. (NYSE:A) . While ACI Worldwide and Avid Technology currently sport a Zacks Rank #1 (Strong Buy), Agilent Technologies carries a Zacks Rank #2 (Buy). You can see the complete list of today’s Zacks #1 Rank stocks here.
Long-term earnings growth for ACI Worldwide, Avid Technology and Agilent Technologies is projected at 12%, 10% and 11.75%, respectively.
Radical New Technology Creates $12.3 Trillion Opportunity
Imagine buying Microsoft (NASDAQ:MSFT) stock in the early days of personal computers… or Motorola (NYSE:MSI) after it released the world’s first cell phone. These technologies changed our lives and created massive profits for investors.
Today, we’re on the brink of the next quantum leap in technology. 7 innovative companies are leading this “4th Industrial Revolution” - and early investors stand to earn the biggest profits.
See the 7 breakthrough stocks now>>
Avid Technology, Inc. (AVID): Free Stock Analysis Report
ACI Worldwide, Inc. (ACIW): Free Stock Analysis Report
WESCO International, Inc. (WCC): Free Stock Analysis Report
Agilent Technologies, Inc. (A): Free Stock Analysis Report
Original post
Zacks Investment Research

