As I have frequently written, we should all separate our political viewpoints from our investment decisions. This does not mean that we must ignore politics.
The astute investor analyzes possible political outcomes. This should be done without passion or emotion. What are the possible scenarios, and what will it mean for investments?
Last week I noted the relative absence of data and events, allowing time for assessment, analysis ---- and vacations for politicians in Europe and Washington. While this week's data calendar is also on the light side, the story will be quite different.
The GOP Convention is now only two weeks away, with the Democrats' event a week later. Now that we know Romney's choice for his running mate, the political campaign has a new edge and focus. I expect a week filled with speculation and projections about the Presidential election and what it means for financial markets.
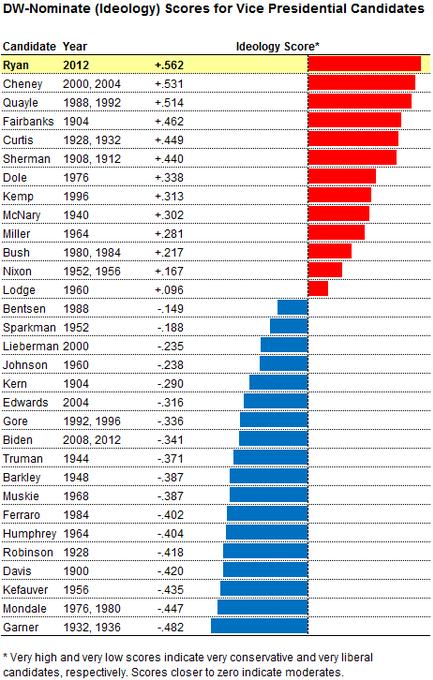
Most of the commentary will focus on how the addition of Ryan will change the election odds. Before the choice, Nate Silver wrote a great column showing the expected return from each choice. Ryan was one of the lower picks, partly because of questions about whether he can even bring in Wisconsin. Silver also notes that Ryan is the most conservative VP candidate in many decades.
After the announcement, Silver suggests that this could be a bold move, necessary to get the needed addition of votes. This is all excellent analysis from a source well worth watching.
You will be bombarded with VP stories in the next few days, but I like this one from Princeton's Julian Zelizer via CNN. He has a nice review of how various past VP choices contributed to the ticket. It provides a nice background for us to think about the current scenario. (Anyone remember Spiro Agnew?)
I'll offer some of my own expectations in the conclusion, but first let us do our regular review of last week's news.
Background on "Weighing the Week Ahead"
There are many good sources for a list of upcoming events. With foreign markets setting the tone for US trading on many days, I especially like the comprehensive calendar from Investing.com. There is also helpful descriptive and historical information on each item.
In contrast, I highlight a smaller group of events. My theme is an expert guess about what we will be watching on TV and reading in the mainstream media. It is a focus on what I think is important for my trading and client portfolios.
This is unlike my other articles where I develop a focused, logical argument with supporting data on a single theme. Here I am simply sharing my conclusions. Sometimes these are topics that I have already written about, and others are on my agenda. I am putting the news in context.
Readers often disagree with my conclusions. Do not be bashful. Join in and comment about what we should expect in the days ahead. This weekly piece emphasizes my opinions about what is really important and how to put the news in context. I have had great success with my approach, but feel free to disagree. That is what makes a market!
Last Week's Data
Each week I break down events into good and bad. Often there is "ugly" and on rare occasion something really good. My working definition of "good" has two components:
- The news is market-friendly. Our personal policy preferences are not relevant for this test. And especially -- no politics.
- It is better than expectations.
There was not much news last week, but there were a few positive highlights.
- Trade data showed higher exports and a lower deficit. This could add significantly (0.5% or more) to the Q2 GDP revisions.
- The baseline economic growth remains positive, but at a sluggish 2% or so. This is not such good news, but it contrasts sharply with the recession talk. Tim Duy's level-headed article helps us keep perspective. He has many great charts, all showing that we seem to have a moderate growth trend. Of special interest is his note that the six and twelve-month growth trends in employment have converged on a gain of 163,000, just as we saw last month.
- Eurozone risk is significantly lower, if judged by data (via Scott Grannis) rather than by opinion and headlines. Swap spreads tell the story.
- Initial jobless claims declined again, down 6000 from last week's (slightly revised) 367,000. The series should now be outside the range of unusual seasonal fluctuations. Doug Short has a comprehensive look at unemployment claims. Joe Weisenthal calls it the "best market indicator" and shows this chart as evidence:

The Bad
The was also not much negative news in a week with a light calendar. I will focus a little more on some key themes.
- Gasoline prices moved higher, up fourteen cents (via Bonddad, with other high frequency indicators as well). This implies less discretionary spending for the average consumer.
- The earnings beat rate drifted south and is the lowest in the bull market recovery (Bespoke). I take this as negative, since most of my analysis is earnings driven. Mark Hulbert cites Ned Davis research for a contrarian take. Briefly put, when growth is "too high" investors are really skeptical and assign a lower multiple. Read the whole story for interesting details.
- The fiscal cliff effect. Most experts do not expect a "fiscal cliff" disaster, putting odds at a (still significant) 15% or so. The problem is the uncertainty. Even though a partisan political process, augmented by poor political leadership, may eventually avoid disaster, will that be enough? The uncertainty created by the process is already producing negative effect.
- The basic uncertainty proposition is nicely explained by Steven Russolillo in the WSJ. He captures the "let's just wait" mentality.
- Additional evidence is provided by an interesting analysis of conference calls from Dennis K. Berman at the WSJ.
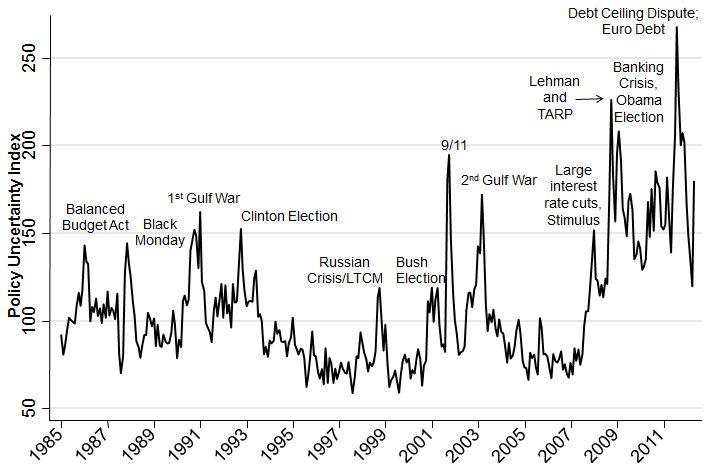
- Objectively measured, policy uncertainty is high (via the academic team reporting at Economic Policy Uncertainty). They provide evidence that "...an increase in economic policy uncertainty as measured by our index foreshadows a decline in economic growth and employment in the following months." Here is a history of uncertainty from their index.

This is showing up in economic forecasts, like that from the Philly Fed's survey of professional forecasters, now showing significantly lower projected growth.
The Ugly
Urban bankruptcies. There is a continuing problem with cities facing declining revenues, the inability to raise taxes, and growing retirement obligations. It is not at the level forecast by Meredith Whitney, but there is a growing list of problem cities. Bloomberg suggests that the California debate favors unions rather than bondholders.
The Silver Bullet
I occasionally give the Silver Bullet award to someone who takes up an unpopular or thankless cause, doing the real work to demonstrate the facts. Think of The Lone Ranger.
This week's award goes to Invictus, writing at The Big Picture. The story starts with John Crudele, who relies unquestioningly on a single dubious source while blaming the BLS for "making workers disappear" and also blaming it all on Clinton. Invictus does an authoritative takedown, covering the history of the change, the reason, and a careful comparison of the two methods. You should read the whole story to see that the changes took decades, were mostly sparked in the Reagan era, and significantly improved the overall measurement of discouraged workers. He shows a great side-by-side comparison and concludes as follows:
"[Importantly, note the improvement in data collection - from 1/4 of the sample, tabulated quarterly to the entire sample, tabulated monthly. That bastard Clinton was trying to get more accurate and reliable information! Damn him!]
See what Crudele’s all worked up about? Me neither. But these are slow summer weeks and there are column inches to fill. That doesn’t, however, mean that the facts should take a vacation."
The Indicator Snapshot
It is important to keep the current news in perspective. My weekly snapshot includes the most important summary indicators:
- The St. Louis Financial Stress Index.
- The key measures from our "Felix" ETF model.
- An updated analysis of recession probability.
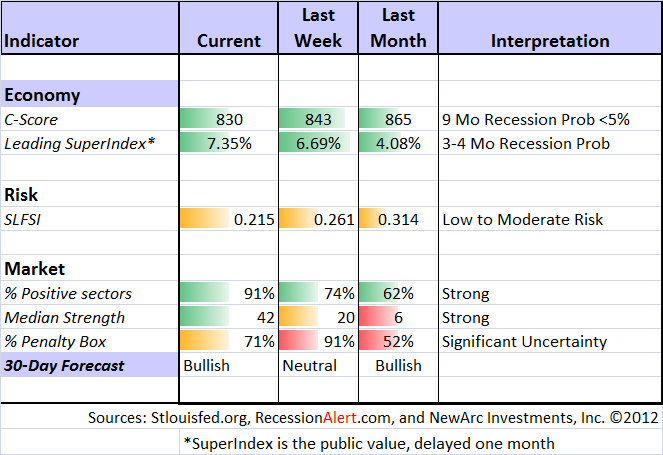
The SLFSI reports with a one-week lag. This means that the reported values do not include last week's market action. The SLFSI has moved a lot lower, and is now out of the trigger range of my pre-determined risk alarm. This is an excellent tool for managing risk objectively, and it has suggested the need for more caution. Before implementing this indicator our team did extensive research, discovering a "warning range" that deserves respect. We identified a reading of 1.1 or higher as a place to consider reducing positions.
The SLFSI is not a market-timing tool, since it does not attempt to predict how people will interpret events. It uses data, mostly from credit markets, to reach an objective risk assessment. The biggest profits come from going all-in when risk is high on this indicator, but so do the biggest losses.
The C-Score is a weekly interpretation of the best recession indicator I found, Bob Dieli's "aggregate spread." I'll explain more about the C-Score soon. We are working on a modification that will make this method even more sensitive. None of the recession methods are worrisome. Bob also has a group of coincident indicators. Like most of the top recession forecasters, he uses these to confirm the long-term prediction. These indicators are also not close to a recession signal.
The evidence against the ECRI recession forecast continues to mount. It is disappointing that those with the best forecasting records get so much less media attention. The idea that a recession has already started is losing credibility with most observers. I urge readers to check out the list of excellent updates from last week.
Readers might also want to review my new Recession Resource Page, which explains many of the concepts people get wrong.
The single best resource for the ECRI call and the ongoing debate is Doug Short, who has a complete and balanced story with frequent updates.
Our "Felix" model is the basis for our "official" vote in the weekly Ticker Sense Blogger Sentiment Poll. We have a long public record for these positions. This week we continued as bullish. We have been bullish since June 23rd, with a one-week move to neutral two weeks ago. These are one-month forecasts for the poll, but Felix has a three-week horizon. The ratings are higher, and the confidence is improving.
[For more on the penalty box see this article. For more on the system ratings, you can write to etf at newarc dot com for our free report package or to be added to the (free) weekly ETF email list. You can also write personally to me with questions or comments, and I'll do my best to answer.]
The Week Ahead
There is a lot of data on tap next week, but little that might really surprise us. The featured story might turn out to be Tuesday's retail sales report, since that has been the one series providing a touch of support for the recessionistas. Wednesday's industrial production is also of interest.
No one expects danger from the inflation data. We have regional Fed indexes from the Empire State and the Philly Fed. I do not place much stock in these reports, but they can move the market if far from expectations.
Initial jobless claims (Thursday) are of continuing importance as the best single real-time indicator of employment changes.
Friday's leading indicators are expected to show a non-recessionary uptick. I am also interested in the Michigan consumer sentiment index (Friday), despite the recent mixed signals.
To summarize, there will be plenty of data, but a big market move from any single report would be surprising.
Trading Time Frame
Our trading positions continued in fully invested mode last week. Felix became more aggressive in a timely fashion. Since we only require three buyable sectors, the trading accounts look for the "bull market somewhere" even when the overall picture is neutral. As the tape has improved, the ratings from Felix have gotten stronger.
Investor Time Frame
Josh Brown has an excellent and thoughtful article, taking his helpful insider perspective on why investors hate the market. He has five reasons, but plenty of subpoints. It is very cynical, and he says that (eventually) it will be right to be a contrarian. It is a great read.
In a similar vein, I believe that this is a very important time for the individual investor, many of whom are making serious mistakes. Here is my list of frequent investor errors:
They try to be traders
The successful investment strategy differs markedly from trading. It is especially important to establish good, long-term positions when prices are favorable. Most individual investors seriously underperform long-term results by selling low and buying high. Most successful professionals, of course, do the opposite.
Even successful years have significant drawdowns. 15% is not unusual. The investor needs to expect this. If it feels stressful, then your asset allocation is wrong.
They think they are experts on world events
Taking a long-term perspective is easier said than done. With everyone on TV explaining with great confidence what just happened (please check out my article on the "message of the markets") it is easy for the average person to think he is out of step. For several weeks I have emphasized the folly of attempts at short-term market timing.
They want to wait too long -- until there are no problems
This is the single most costly mistake. If there were no problems, the market would be at 20K or higher. Investing requires balancing risk and reward, not waiting for complete safety.
There is no magic moment. Resolving market worries is a process, not an event.
I tried to explain the most important concept for individual investors in this article about the Wall of Worry. I have had many emails from people who had a personal breakthrough in their investing when they understood this concept. If you missed it, I urge you to take a look. You can contrast this with the many pundits who claim miracles of market timing.
The market action in the last four weeks has once again illustrated market moves based on unpredictable factors. Skeptics can call it a "mystery rally," but that is just an admission of the failure of their market-timing methods.
They fail to see what is working
Our single best strategy through the various gyrations has been buying dividend stocks and selling calls for enhanced yield. Doug Short notes the decline in volatility, calling it "Siesta Time." This is music to the ears of those selling calls against their dividend stock positions for a yield of 8-10% with greater safety than pure stock ownership.
Take what the market is offering!
...and here are my examples.
Final Thoughts on the Election Effects
Most of the election discussion will focus on how the Ryan selection changes the possible outcome. It is fun to discuss the "horse race" aspect of campaigns. The personal pluses and minuses of candidates are also great for discussion since anyone can join in without actually doing much research.
We will get a major dose of this on the Sunday morning talk shows, but both campaigns are already in full spin mode. By contrast, here are two themes to consider, based more on changing the framing of issues:
- Should US policy place greater emphasis on deficit reduction? At what costs?
- Will Ryan offset and/or clarify the Romney position on health care? What stocks could be affected by Medicare changes?
In issues like this, stocks may react even before the election, just because the issues have been defined differently.
And one bonus forecast: Mark your calendar for October 11th, the night of the VP debate. There are already advance predictions for the success of the smooth-talking Ryan versus Joe Biden. One commentator made the Olympic analogy of LeBron James versus a smaller opponent -- dunking and shooting three's. In the debate game, driving expectations lower is half the battle, so the Biden camp will encourage these thoughts!
